| Issue |
A&A
Volume 709, May 2026
|
|
|---|---|---|
| Article Number | A2 | |
| Number of page(s) | 5 | |
| Section | Atomic, molecular, and nuclear data | |
| DOI | https://doi.org/10.1051/0004-6361/202659362 | |
| Published online | 28 April 2026 | |
Ammonia deuteration mechanism in interstellar conditions
Ion trap study of D3+ + NH3 reaction
1
Department of Surface and Plasma Science, Faculty of Mathematics and Physics, Charles University,
V Holešovičkách 2,
180 00
Prague,
Czech Republic
2
Alexandru Ioan Cuza University of Iași,
Iași,
Romania
★ Corresponding author: This email address is being protected from spambots. You need JavaScript enabled to view it.
Received:
6
February
2026
Accepted:
18
March
2026
Abstract
Aims. We investigate the reaction mechanism of deuterium transfer in the D3+ + NH3 reaction. The distinction between proton hop and full scrambling mechanisms is critical for accurate modeling of deuterated ammonia isotopologs.
Methods. The reaction rate coefficients and product branching fractions were measured in a cryogenic 22-pole radiofrequency ion trap between 110 and 300 K. The D3+ ions were stored in helium buffer gas at number densities of 1013−1014 cm−3 and reacted with ammonia at controlled number densities of 1010−1011 cm−3.
Results. The reaction proceeds with reaction rate coefficients decreasing from (5.4 ± 1.1) × 10−9 cm3s−1 at 149 K to (3.9 ± 0.8) × 10−9 cm3s−1 at 293 K, close to the capture rate coefficient predicted by the average dipole orientation theory. The measured reaction rate coefficients exhibit a systematic isotope effect compared to the analogous H3+ + NH3 system, with D3+ reacting slightly more slowly. The product branching fractions reveal that NH3D+ is the dominant product throughout the temperature range, with a branching fraction greater than 99.5% at low temperatures. This observation confirms that the reaction proceeds via the proton hop mechanism rather than full scrambling.
Key words: astrochemistry / molecular data / molecular processes / methods: laboratory: molecular / ISM: molecules
© The Authors 2026
 Open Access article, published by EDP Sciences, under the terms of the Creative Commons Attribution License (https://creativecommons.org/licenses/by/4.0), which permits unrestricted use, distribution, and reproduction in any medium, provided the original work is properly cited.
This article is published in open access under the Subscribe to Open model. This email address is being protected from spambots. You need JavaScript enabled to view it. to support open access publication.
1 Introduction
Deuterium fractionation in interstellar molecules provides a sensitive indicator of the physical and chemical conditions in cold molecular clouds. At the low temperatures characteristic of the interstellar medium (ISM), typically 10–100 K, the replacement of hydrogen with deuterium becomes energetically favorable due to differences in vibrational zero-point energies (Nyman 2016). For ammonia, the energy gain increases with each successive deuteration step, leading to significant populations of NH2D, NHD2, and even ND3 in cold dense cores (Roueff et al. 2005). Observations of these deuterated isotopologs are commonly used to constrain the thermal and chemical evolution of star-forming regions (Le Gal et al. 2014; Millar 2015; Redaelli et al. 2023).
In the late phases of the chemical evolution of cold and dense cores, ammonia has already formed through ion-molecule reactions in the gas phase, and its isotopic composition is later determined by a series of ionization and recombination reactions (Sipilä et al. 2015b). In this cycle, cosmic-ray ionization produces H3+, which undergoes successive deuteration through reactions with HD to form H2D+, HD2+, and D3+ (Harju et al. 2017). These deuterated ions then transfer protons or deuterons to ammonia:
![Mathematical equation: $\[\mathrm{H}_{3-n} \mathrm{D}_n{}^{+}+\mathrm{NH}_3 \longrightarrow \mathrm{NH}_{4-m} \mathrm{D}_m{}^{+}+\mathrm{H}_{2-n+m} \mathrm{D}_{n-m}, \quad m \leq n \leq 3.\]$](/articles/aa/full_html/2026/05/aa59362-26/aa59362-26-eq1.png) (1)
(1)
The resulting deuterated ammonium ions undergo dissociative recombination with electrons, regenerating neutral deuterated ammonia and completing the cycle. This gas phase pathway is the primary mechanism for ammonia deuteration in the ISM (Harju et al. 2017; Sipilä et al. 2015b).
The outcome of the reaction (1) depends substantially on the reaction mechanism. Two distinct pathways are possible. In the “proton hop” (PH) mechanism, a single hydrogen or deuterium nucleus is transferred from H3−nDn+ to NH3, with the remaining nuclei retaining their identity. Alternatively, reactants can form a long-lived [NH3⋯H3]+ complex in which full hydrogen-deuterium scrambling (FS) occurs before dissociation. These mechanisms lead to fundamentally different product branching ratios (Harju et al. 2017; Sipilä et al. 2019). For example, consider the reaction of NH3 with HD2+. The PH mechanism can produce only NH3D+ (via D transfer) or NH4+ (via H transfer), whereas the FS mechanism allows for the formation of NH2D2+ through complete mixing of all six hydrogen/deuterium nuclei. Thus, PH favors singly deuterated products, while FS enables multiple deuteration, making the product branching ratios a direct experimental diagnostic of the dominant mechanism.
Astrochemical models frequently assume that FS occurs in the H3+ + NH3 system (Le Gal et al. 2014; Sipilä et al. 2015a; Harju et al. 2017). However, comparisons with astronomical observations of deuterated ammonia show systematic discrepancies with FS-based predictions (Harju et al. 2017; Sipilä et al. 2019). To reconcile models with observations, recent work has employed mixed PH and FS mechanisms (Furuya & Persson 2018; Sipilä et al. 2019), and the astronomical observations of the nuclear spin state ratios for deuterated ammonia in pre-stellar cores (Harju et al. 2024, 2025) strongly suggest that reaction (1) proceeds via PH. Nevertheless, without experimental constraints on branching ratios, the dominant pathway remains undetermined.
Experimental studies of the H3+ + NH3 reaction system are limited. The non-deuterated reaction has been studied at room temperature and above (Hemsworth et al. 1974; Kim et al. 1974; Lindinger et al. 1975) and at 30 K (Marquette 1989). The only investigation of a deuterated variant is the study of D3+ + NH3 by Smith & Futrell (1974), who concluded that the reaction product is NH3D+ in collisions with vibrationally cold D3+. However, no explicit attempt was made to detect the multiply deuterated products. No measurements of product branching ratios, the key experimental signature to distinguish between PH and FS, have been reported at any temperature. Studies of the related reaction NH4+ + D2 found no evidence of exchange reactions (Kim et al. 1975; Barlow & Dunn 1987), but the NH4+ + H2 system has less potential energy than the NH3 + H3+ system, so the relevance of this result to the present study is limited. Notably, the competition between PH and FS mechanisms has also been studied in a recent laboratory study of the astrophysically relevant reaction of HCl+ with H2 (Jiménez-Redondo et al. 2025), where only the PH mechanism was observed in agreement with the theory (Gal et al. 2017).
Although we are not aware of any theoretical calculation of the rate coefficient of reaction (1), the general average dipole orientation (ADO) theory of Su & Chesnavich (1982) can be used to calculate the capture rate coefficient based on the NH3 polarizability of 14.19 a.u. (Olney et al. 1997) and the dipole moment 1.4758 D (Shimizu 1970). The calculated capture rate coefficients are in good agreement with the measured reaction rate coefficients at room temperature. However, the reaction rate coefficients measured at elevated temperatures (Lindinger et al. 1975) significantly exceed the ADO capture rate coefficients, and, conversely, the reaction rate coefficient at 30 K (Marquette 1989) is well below the ADO prediction. This indicates that the ADO theory has only limited applicability for predicting the reaction rate coefficients. Nevertheless, the ADO theory forms the basis for the description of the reaction (1) rate coefficients in the UMIST (Millar et al. 2024) and KIDA (Wakelam et al. 2024) astrochemical databases (see Fig. 4 for an illustration of the discussed temperature dependencies).
In this work, we have studied the reaction of D3+ with NH3 between 110 and 300 K. We have measured the total reaction rate coefficient to validate the use of the ADO theory for its calculation. The branching fractions for the production of NH3D+, NH2D2+, and NHD3+ have been measured in order to distinguish between the PH and FS mechanisms.
2 Experiment
A 22-pole cryogenic RF ion trap was used to measure the temperature-dependent reaction rate coefficient and product branching fractions for the D3+ + NH3 reaction. The trap confines ions using inhomogeneous RF fields (Gerlich 1992) and operates at nominal temperatures, T22PT, of between 10 K and 300 K. The kinetic temperature of the ions is estimated as T = T22PT + (5 ± 5) K based on the previous characterization of the apparatus (Kovalenko et al. 2018; Zymak et al. 2013). A brief description is provided here.
The 22-pole ion trap consists of 22 parallel cylindrical electrodes connected alternately to opposite phases of an RF potential, generating an effective radial confining potential (Gerlich 1992). The D3+ ions were produced externally in a storage ion source by electron bombardment of D2 gas (electron energy 55 eV, D2 pressure ≈10−6 hPa). The ions are periodically extracted from the source, mass-selected using a quadrupole mass filter, and directed into the trap through a 90° electrostatic bender. Once inside the trap, the ions are thermalized to trap temperature through collisions with the helium buffer gas before undergoing reactions with ammonia. The helium buffer gas fills the trap at number densities in the range of 1013 to 1014 cm−3, which is sufficient to thermalize the ions within a few milliseconds after injection.
The nuclear spin states of D3+ are not thermalized in collisions with He, and the typical number densities of D2 (≈108 cm−3), which is leaking from the ion source, are not sufficient to thermalize the nuclear spin states during the measurement (Hugo et al. 2009). The ortho : meta : para nuclear spin states of the D3+ ions therefore remain populated at the statistical ratios of 16 : 10 : 1. Nevertheless, in the studied temperature range, this is close to the equilibrium population in normal D2 (e.g., 15: 10: 1.4 at 100 K; Hugo et al. 2009).
The ammonia reactant was introduced directly into the trap through a regulated leak valve, maintaining number densities of 1010 to 1011 cm−3. The present measurements were performed at nominal temperatures above 100 K to prevent ammonia condensation on the trap electrodes.
The neutral gas temperature, Tg, may also exceed the nominal gas temperature by up to 10 K (Tran et al. 2018) and we define Tg = T22PT + (5 ± 5) K. The number densities in the trap were determined from pressure measurements in the outer trap vacuum chamber using a Bayard-Alpert ionization gauge. This gauge was calibrated against a spinning rotor gauge connected directly to the trap volume. The number density of species x at the gas temperature, [X]g, was calculated from the density measured at room temperature, [X]room, using the relation for thermal transpiration in the molecular regime: ![Mathematical equation: $\[[X]_{\mathrm{g}}=[X]_{\text {room }} \sqrt{T_{\text {room }} / T_{\mathrm{g}}}\]$](/articles/aa/full_html/2026/05/aa59362-26/aa59362-26-eq2.png) . The uncertainty of this procedure is estimated to be 20%, which contributes to a systematic uncertainty of the absolute values of the rate coefficients.
. The uncertainty of this procedure is estimated to be 20%, which contributes to a systematic uncertainty of the absolute values of the rate coefficients.
After a controlled trapping (reaction) time, t, the ions are extracted from the trap, mass analyzed using a second quadrupole mass filter, and detected by a microchannel plate detector operated in ion counting mode. By systematically varying the trapping time and scanning the mass filter across the relevant mass range, we obtain the time evolution of the number of detected ions of different masses.
Upon the injection of D3+ ions into the trap, a mass analysis of the trapped ions has shown the production of ions at m/z 19, 20, 21, 22, and 30. At later trapping times, a significant signal at m/z 18 appears as well. This corresponds to secondary production of NH4+ in the fast reaction of NH3D+ with NH3 Harrison et al. (1976). Due to the possibility of parasitic reactions of D3+ with residual H2O and N2, we expect the formation of minor amounts of deuterated H3O+ and N2H+ ions, and the mass assignment is therefore not unambiguous, as is summarized in Table 1. Note that we also consider the possibility of forming ND4+ in subsequent isotope exchange reactions.
The detection efficiency of our system varies with the ion mass as a result of the mass-dependent transmission of the quadrupole mass filter and the detection characteristics of the microchannel plate. We denote the detection efficiency of ions with m/z of p relative to ions with m/z of q as ![Mathematical equation: $\[\eta_{p}^{q}\]$](/articles/aa/full_html/2026/05/aa59362-26/aa59362-26-eq3.png) . For the relevant product ions, the relative discrimination was calibrated using hydrogen abstraction reactions with a single product channel (Rednyk et al. 2019; Kovalenko et al. 2021). We used NH3D+ as the reference species with a relative discrimination factor of
. For the relevant product ions, the relative discrimination was calibrated using hydrogen abstraction reactions with a single product channel (Rednyk et al. 2019; Kovalenko et al. 2021). We used NH3D+ as the reference species with a relative discrimination factor of ![Mathematical equation: $\[\eta_{19}^{19}=1\]$](/articles/aa/full_html/2026/05/aa59362-26/aa59362-26-eq4.png) and for the heavier product ions we obtained
and for the heavier product ions we obtained ![Mathematical equation: $\[\eta_{20}^{19}= 0.87(16), \eta_{21}^{19}=0.74(12)\]$](/articles/aa/full_html/2026/05/aa59362-26/aa59362-26-eq5.png) , and
, and ![Mathematical equation: $\[\eta_{22}^{19}=0.59(11)\]$](/articles/aa/full_html/2026/05/aa59362-26/aa59362-26-eq6.png) . For the ions with m/z 30, the discrimination was determined with respect to the reactant ions using the reaction of D3+ with N2 as
. For the ions with m/z 30, the discrimination was determined with respect to the reactant ions using the reaction of D3+ with N2 as ![Mathematical equation: $\[\eta_{30}^{6}=0.35(10)\]$](/articles/aa/full_html/2026/05/aa59362-26/aa59362-26-eq7.png) .
.
To extract the reaction rates and branching fractions, the time-dependent decay of the number of D3+ ions in the trap and the corresponding growth of the product ion numbers were fit with a kinetic model. For the primary ion, the model is
![Mathematical equation: $\[n_{\mathrm{D}_3^{+}}(t)=n_0 ~\exp (-r t),\]$](/articles/aa/full_html/2026/05/aa59362-26/aa59362-26-eq8.png) (2)
(2)
where n0 is the initial number of D3+ ions and r is the reaction rate. The total reaction rate coefficient, k, was obtained as k = r/ [NH3]. For product ions, the time evolution was fit with
![Mathematical equation: $\[n_i(t)=n_0 ~\mathrm{BR}_i(1-\exp (-r t))+n_i(0),\]$](/articles/aa/full_html/2026/05/aa59362-26/aa59362-26-eq9.png) (3)
(3)
where BRi = ri/r is the measured branching fraction for the product channel with m/z i, with formation rate ri.
The discrimination-corrected branching fractions, BFi, were obtained from the measured branching fractions by correcting for the discrimination factors relative to the primary ions, ![Mathematical equation: $\[\eta_{i}^{6}\]$](/articles/aa/full_html/2026/05/aa59362-26/aa59362-26-eq10.png) , as
, as
![Mathematical equation: $\[\mathrm{BF}_i=\mathrm{BR}_i / \eta_i^6.\]$](/articles/aa/full_html/2026/05/aa59362-26/aa59362-26-eq11.png) (4)
(4)
For the product ions with m/z 19, 20, 21, and 22, the discrimination relative to the primary ion can be expressed using the known discrimination factors as ![Mathematical equation: $\[\eta_{i}^{6}=\eta_{19}^{6} \eta_{i}^{19}\]$](/articles/aa/full_html/2026/05/aa59362-26/aa59362-26-eq12.png) . The unknown factor
. The unknown factor ![Mathematical equation: $\[\eta_{19}^{6}\]$](/articles/aa/full_html/2026/05/aa59362-26/aa59362-26-eq13.png) , which is close to unity in the present setup, was obtained from the normalization condition, ∑i BFi = 1.
, which is close to unity in the present setup, was obtained from the normalization condition, ∑i BFi = 1.
Assignment of the m/z values of the observed ions.
3 Results and discussion
An example of the time evolution of the numbers of ions in the trap obtained at T = 200 K, [NH3] = 1.0 × 1010 cm−3, and [He] = 4.9 × 1013 cm−3 is shown in Fig. 1. The product ion counts have been corrected for discrimination with respect to D3+ and the presented numbers are normalized by the total number of ions detected after injection, nΣ0.
The primary D3+ ions react rapidly with NH3 and are predominantly converted to product ions with m/z 19 (NH3D+). As can be seen in Fig. 1, we observed the production of a small fraction of deuterated isotopologs of NH4+ and H3O+ at m/z 20, 21, and 22, as well as N2D+ at m/z 30 (see also Table 1). The total reaction rates and branching fractions were evaluated by fitting these raw data with the kinetic model given by Eqs. (2) and (3).
3.1 Reaction rate coefficient of D3+ + NH3
To verify the binary character of the D3+ + NH3 reaction, we measured the dependence of the reaction loss rate, r, on the NH3 number density at two representative temperatures. Fig. 2 shows these dependencies measured at T = 208 K and T = 265 K, with helium buffer gas densities of [He] = 5.0 × 1013 cm−3 and 4.4 × 1013 cm−3, respectively. The observed linear dependencies shown in Fig. 2 confirm that the reaction is a binary process under our experimental conditions. The data were fit with a linear function, r = k[NH3] + r0, where k is the reaction rate coefficient and r0 accounts for background loss processes. In the present study, the typical background loss rates are on the order of 0.01 s−1.
The linearity of the pressure dependencies allows us to evaluate the reaction rate coefficients from measurements at a single reactant pressure in subsequent measurements (with [NH3] in the range (1–2) × 1010 cm−3). After subtraction of the small background loss rate, r0 (measured without the reactant gas), the reaction rate coefficients are evaluated as k = (r − r0)/[NH3]. For simplicity, the raw measured rate coefficients are binned in temperature and averaged as shown in Fig. 3. The measurements are limited to temperatures above 140 K to avoid the influence of ammonia condensation on the determination of the number density. These data are in agreement with the values obtained from the pressure dependence measurements within the systematic error (shown as stars in the figure).
The present results are compared with the room-temperature value of Smith & Futrell (1974) and with the literature data for the analogous H3+ + NH3 system measured by Hemsworth et al. (1974), Kim et al. (1974), Lindinger et al. (1975), Marquette (1989), Praxmarer et al. (1994), and Smith & Futrell (1974) in Fig. 4. The figure also shows the theoretical capture rate coefficients calculated using the ADO theory (Su & Chesnavich 1982) for both H3+ and D3+ systems, with which our results are in good agreement. The rate coefficients of the H3+ + NH3 reaction listed in the UMIST (Millar et al. 2024) and KIDA (Wakelam et al. 2024) databases indicated in the figure closely follow the theoretical capture rate coefficient below 300 K. The comparison between the D3+ and H3+ systems reveals a systematic isotope effect, with the measured rate for D3+ slightly lower than previously reported rates for H3+, consistent with the expected effect of the higher reduced mass.
 |
Fig. 1 Dependence of normalized numbers of ions in the trap on storage time, t, for the D3+ + NH3 reaction. The measured data are indicated as triangles (D3+), circles (NH3D+), squares (m/z 20), diamonds (m/z 21) and pentagons (m/z 22). The signal at m/z 30 (hexagons) corresponds to N2D+ formed from reaction with background N2. The crosses (Σ) indicate the total number of ions. The lines indicate the fit kinetic model. The data were measured at T = 200 K, [NH3] = 1.0 × 1010 cm−3, and [He] = 4.9 × 1013 cm−3. |
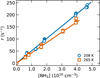 |
Fig. 2 Dependence of the reaction loss rate, r, on the NH3 number density [NH3] for the D3+ + NH3 reaction. The data were obtained at T = 208 K (circles) and T = 265 K (squares). The reaction rate coefficients obtained from the linear fit of the measured dependencies (solid lines) are k(208 K) = (5.11 ± 0.10) × 10−9 cm3 s−1 and k(265 K) = (4.27 ± 0.05) × 10−9 cm3 s−1. The stated uncertainties are statistical errors of the fit. The systematic uncertainty of number density and rate coefficients is 20%. |
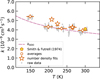 |
Fig. 3 Temperature dependence of the reaction rate coefficient, k, for the D3+ + NH3 reaction measured between 140 and 300 K. Present data (small circles: raw data measured at single pressure; large circles: averaged raw data; stars: pressure dependence fits) are compared with the value of Smith & Futrell (1974) and with the theoretical capture rate coefficient calculated using the ADO theory. The statistical errors are indicated. The systematic uncertainty of 20 % is omitted for clarity. |
3.2 Product branching fractions
The temperature dependence of the product branching fractions for the D3+ + NH3 reaction between 110 and 270 K is shown in Fig. 5. The NH3D+ ion is the dominant product throughout the temperature range, with branching fractions exceeding 97%. Products at m/z 20, 21, and 22 are observed, but their combined branching fraction remains below 3%. These signals may contain contributions from both multiply deuterated ammonium (NH2D2+, NHD3+, ND4+) and deuterated hydronium (H2DO+, HDO2+, D2OH+) formed from residual water vapor in the trap. The signal at m/z 20 increases from about 0.5% at 130 K to 2–3% at 270 K, rapidly increasing near 190 K, coinciding with the water freeze-out. This behavior strongly suggests that m/z 20 contains a significant contribution from H2DO+. Similarly, the observed rapid decrease in the relative fraction of ions at m/z 21 and 22 below 190 K indicates that these correspond to multiply deuterated H3O+ isotopologs. The observed branching fraction for NH3D+ products should therefore be interpreted as a lower limit, and conversely, the branching fractions for m/z 20 and 21 are upper limits for the production of NH2D2+ and NHD3+ in reaction (1).
The presence of N2D+ (m/z 30, formed from background N2) in our mass spectra serves as a sensitive diagnostic for NH3 condensation at low temperatures. Although N2D+ is not a product of the D3+ + NH3 reaction, it is included in the branching fraction to consider all ion losses from the D3+ population. Fig. 5 shows that the N2D+ branching fraction remains nearly constant (around 0.3–0.5%) between 110 K and 230 K. At 100 K and below, the N2D+ branching fraction begins to increase as the number density of N2 relative to NH3 increases due to NH3 condensation. Based on the N2D+ signal behavior, we limited our branching fraction analysis to temperatures of T ≥ 110 K to ensure reliable conditions. Measurements at lower temperatures (shown as open symbols in Fig. 5) are affected by NH3 freeze-out.
Despite the uncertainty in the mass assignment for products with m/z 20 or greater, the predominant formation of NH3D+ clearly indicates that the reaction follows a PH mechanism rather than FS. If scrambling occurred, the expected statistical product distribution from FS would favor multiply deuterated products (Sipilä et al. 2019; Harju et al. 2017). However, the observed production rate of NH3D+ at m/z 19 accounts for more than 97% of the total reaction rate, with all heavier masses contributing <3% combined. At temperatures between 110 and 150 K, where the water vapor is effectively cryo-pumped, our data indicate that the branching fraction for the production of NH2D2+ is just around 0.5% and the more deuterated ammonium ions are undetectable (BF < 10−5). That is, the branching fraction for NH3D+ production is approximately 99.5% (neglecting the fraction of ions at m/z 30, which are not produced in the D3+ + NH3 reaction).
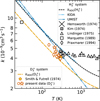 |
Fig. 4 Overview of the available rate coefficients for the reaction of NH3 with H3+ and D3+. The present data and the results of Smith & Futrell (1974) are compared with literature values for the H3+ + NH3 reaction from Hemsworth et al. (1974), Kim et al. (1974), Lindinger et al. (1975), Marquette (1989), and Praxmarer et al. (1994). The lines represent the ADO capture rate coefficients and the values in the KIDA and UMIST databases for the H3+ system (see legend). |
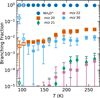 |
Fig. 5 Temperature dependence of the product branching fractions for the D3+ + NH3 reaction measured between 110 and 270 K. The data show the probability of formation of NH3D+ (circles), m/z 20 (squares), m/z 21 (diamonds), m/z 22 (pentagons), and m/z 30 (hexagons, N2D+ from background N2). The dominant channel remains NH3D+ formation across the entire temperature range; see the text for an interpretation of the minor reaction channels. Open symbols indicate measurements at T < 110 K that are influenced by NH3 freeze out, as evidenced by the increasing signal at m/z 30 (N2D+) from reactions with residual N2. |
4 Conclusion
We measured the reaction rate coefficients and product branching fractions for the D3+ + NH3 reaction between 110 and 300 K. The reaction proceeds at rates close to the collisional limit, with rate coefficients decreasing from (5.4 ± 1.1) × 10−9 cm3 s−1 at 149 K to (3.9 ± 0.8) × 10−9 cm3 s−1 at 293 K in good agreement with the predictions of the ADO theory (Su & Chesnavich 1982). When compared to the analogous H3+ system, the measured reaction rate coefficients exhibit a systematic isotope effect, with D3+ reacting slightly slower, consistent with the expected effect of the higher reduced mass.
The most significant finding is that the NH3D+ ion is the dominant product of reaction (1) throughout the entire temperature range, with branching fractions ranging from 97% at room temperature (lower limit) up to 99.5% at temperatures below 150 K, where the water contamination is reduced. Products at higher m/z (20 or greater) collectively contribute less than 3% of the total product distribution, and this fraction decreases to ≈0.5% below 150 K (when the products with m/z 30 are excluded). This observation directly confirms that the reaction proceeds via the PH mechanism rather than FS. Our results are consistent with the room temperature study of Smith & Futrell (1974).
In recent astrochemical models, reaction (1) is often treated as fully scrambling (Le Gal et al. 2014; Sipilä et al. 2015a; Harju et al. 2017), yet astronomical observations reveal systematic discrepancies with such predictions (Harju et al. 2017; Sipilä et al. 2019), particularly in nuclear spin state ratios (Harju et al. 2024, 2025). The dominance of single deuteron transfer leading to NH3D+ in our experimental branching fractions strongly indicates that the PH mechanism controls this reaction. However, further measurements with H2D+ and HD2+ may be needed to confirm the PH mechanism in all isotopic variants of reaction (1). This result aligns with recent models that show an improved consistency with astronomical data when assuming PH instead of FS in gas-phase deuteration pathways (Sipilä et al. 2019; Harju et al. 2024). The present results thus reduce the uncertainty concerning the deuteration of ammonia in collisions with deuterated H3+ isotopologs in astrochemical models.
Data availability
The data that support the findings of this study are openly available on the open data repository platform Zenodo and are accessible under the DOI:10.5281/zenodo.18465949.
Acknowledgements
This work was partly supported by the Czech Science Foundation project GACR 23-05439S. O.E.H.A. was partly funded by the Mexican agency for Science, Humanities, Technology and Innovation (SECIHTI; scholarship no. 836571).
References
- Barlow, S. E., & Dunn, G. H. 1987, IJMSI, 80, 227 [Google Scholar]
- Furuya, K., & Persson, M. V. 2018, MNRAS, 476, 4994 [NASA ADS] [CrossRef] [Google Scholar]
- Gal, R. L., Xie, C., Herbst, E., et al. 2017, A&A, 608, A96 [NASA ADS] [CrossRef] [EDP Sciences] [Google Scholar]
- Gerlich, D. 1992, in AdChP (John Wiley & Sons, Ltd), 1 [Google Scholar]
- Harju, J., Daniel, F., Sipilä, O., et al. 2017, A&A, 600, A61 [NASA ADS] [CrossRef] [EDP Sciences] [Google Scholar]
- Harju, J., Pineda, J. E., Sipilä, O., et al. 2024, A&A, 682, A8 [NASA ADS] [CrossRef] [EDP Sciences] [Google Scholar]
- Harju, J., Caselli, P., Sipilä, O., et al. 2025, A&A, 700, A141 [NASA ADS] [CrossRef] [EDP Sciences] [Google Scholar]
- Harrison, A. G., Lim, P. H., & Tsang, C. W. 1976, IJMIP, 19, 23 [Google Scholar]
- Hemsworth, R. S., Payzant, J. D., Schiff, H. I., & Bohme, D. K. 1974, CPL, 26, 417 [Google Scholar]
- Hugo, E., Asvany, O., & Schlemmer, S. 2009, JChPh, 130, 164302 [Google Scholar]
- Jiménez-Redondo, M., Sipilä, O., Dahl, R., Caselli, P., & Jusko, P. 2025, ESC, 9, 782 [Google Scholar]
- Kim, J. K., Theard, L. P., & Huntress, W. T. J. 1974, IJMIP, 15, 223 [Google Scholar]
- Kim, J. K., Theard, L. P., & Huntress, W. T. J. 1975, JChPh, 62, 45 [NASA ADS] [Google Scholar]
- Kovalenko, A., Tran, T. D., Rednyk, S., et al. 2018, ApJ, 856, 100 [NASA ADS] [CrossRef] [Google Scholar]
- Kovalenko, A., Roučk, Š., Tran, T. D., et al. 2021, JChPh, 154, 094301 [Google Scholar]
- Le Gal, R., Hily-Blant, P., Faure, A., et al. 2014, A&A, 562, A83 [NASA ADS] [CrossRef] [EDP Sciences] [Google Scholar]
- Lindinger, W., Albritton, D. L., Fehsenfeld, F. C., Schmeltekopf, A. L., & Ferguson, E. E. 1975, JChPh, 62, 3549 [Google Scholar]
- Marquette, J. B. 1989, A&A, 213, L29 [Google Scholar]
- Millar, T. J. 2015, PSST, 24, 043001 [Google Scholar]
- Millar, T. J., Walsh, C., Van de Sande, M., & Markwick, A. J. 2024, A&A, 682, A109 [NASA ADS] [CrossRef] [EDP Sciences] [Google Scholar]
- Nyman, G. 2016, MolAs, 3, 10 [Google Scholar]
- Olney, T. N., Cann, N. M., Cooper, G., & Brion, C. E. 1997, Chem. Phys., 223, 59 [NASA ADS] [CrossRef] [Google Scholar]
- Praxmarer, C., Hansel, A., & Lindinger, W. 1994, JChPh, 100, 8884 [Google Scholar]
- Redaelli, E., Bizzocchi, L., Caselli, P., & Pineda, J. E. 2023, A&A, 674, L8 [NASA ADS] [CrossRef] [EDP Sciences] [Google Scholar]
- Rednyk, S., Roučka, Š., Kovalenko, A., et al. 2019, A&A, 625, A74 [NASA ADS] [CrossRef] [EDP Sciences] [Google Scholar]
- Roueff, E., Lis, D. C., van der Tak, F. F. S., Gerin, M., & Goldsmith, P. F. 2005, A&A, 438, 585 [NASA ADS] [CrossRef] [EDP Sciences] [Google Scholar]
- Shimizu, F. 1970, JChPh, 52, 3572 [Google Scholar]
- Sipilä, O., Caselli, P., & Harju, J. 2015a, A&A, 578, A55 [Google Scholar]
- Sipilä, O., Harju, J., Caselli, P., & Schlemmer, S. 2015b, A&A, 581, A122 [NASA ADS] [CrossRef] [EDP Sciences] [Google Scholar]
- Sipilä, O., Caselli, P., & Harju, J. 2019, A&A, 631, A63 [Google Scholar]
- Smith, D. L., & Futrell, J. H. 1974, CPL, 24, 611 [Google Scholar]
- Su, T., & Chesnavich, W. J. 1982, JChPh, 76, 5183 [Google Scholar]
- Tran, T. D., Rednyk, S., Kovalenko, A., et al. 2018, ApJ, 854, 25 [NASA ADS] [CrossRef] [Google Scholar]
- Wakelam, V., Gratier, P., Loison, J.-C., et al. 2024, A&A, 689, A63 [NASA ADS] [CrossRef] [EDP Sciences] [Google Scholar]
- Zymak, I., Hejduk, M., Mulin, D., et al. 2013, ApJ, 768, 86 [NASA ADS] [CrossRef] [Google Scholar]
All Tables
All Figures
|
Fig. 1 Dependence of normalized numbers of ions in the trap on storage time, t, for the D3+ + NH3 reaction. The measured data are indicated as triangles (D3+), circles (NH3D+), squares (m/z 20), diamonds (m/z 21) and pentagons (m/z 22). The signal at m/z 30 (hexagons) corresponds to N2D+ formed from reaction with background N2. The crosses (Σ) indicate the total number of ions. The lines indicate the fit kinetic model. The data were measured at T = 200 K, [NH3] = 1.0 × 1010 cm−3, and [He] = 4.9 × 1013 cm−3. |
| In the text | |
|
Fig. 2 Dependence of the reaction loss rate, r, on the NH3 number density [NH3] for the D3+ + NH3 reaction. The data were obtained at T = 208 K (circles) and T = 265 K (squares). The reaction rate coefficients obtained from the linear fit of the measured dependencies (solid lines) are k(208 K) = (5.11 ± 0.10) × 10−9 cm3 s−1 and k(265 K) = (4.27 ± 0.05) × 10−9 cm3 s−1. The stated uncertainties are statistical errors of the fit. The systematic uncertainty of number density and rate coefficients is 20%. |
| In the text | |
|
Fig. 3 Temperature dependence of the reaction rate coefficient, k, for the D3+ + NH3 reaction measured between 140 and 300 K. Present data (small circles: raw data measured at single pressure; large circles: averaged raw data; stars: pressure dependence fits) are compared with the value of Smith & Futrell (1974) and with the theoretical capture rate coefficient calculated using the ADO theory. The statistical errors are indicated. The systematic uncertainty of 20 % is omitted for clarity. |
| In the text | |
|
Fig. 4 Overview of the available rate coefficients for the reaction of NH3 with H3+ and D3+. The present data and the results of Smith & Futrell (1974) are compared with literature values for the H3+ + NH3 reaction from Hemsworth et al. (1974), Kim et al. (1974), Lindinger et al. (1975), Marquette (1989), and Praxmarer et al. (1994). The lines represent the ADO capture rate coefficients and the values in the KIDA and UMIST databases for the H3+ system (see legend). |
| In the text | |
|
Fig. 5 Temperature dependence of the product branching fractions for the D3+ + NH3 reaction measured between 110 and 270 K. The data show the probability of formation of NH3D+ (circles), m/z 20 (squares), m/z 21 (diamonds), m/z 22 (pentagons), and m/z 30 (hexagons, N2D+ from background N2). The dominant channel remains NH3D+ formation across the entire temperature range; see the text for an interpretation of the minor reaction channels. Open symbols indicate measurements at T < 110 K that are influenced by NH3 freeze out, as evidenced by the increasing signal at m/z 30 (N2D+) from reactions with residual N2. |
| In the text | |
Current usage metrics show cumulative count of Article Views (full-text article views including HTML views, PDF and ePub downloads, according to the available data) and Abstracts Views on Vision4Press platform.
Data correspond to usage on the plateform after 2015. The current usage metrics is available 48-96 hours after online publication and is updated daily on week days.
Initial download of the metrics may take a while.