Fig. 3.
Download original image
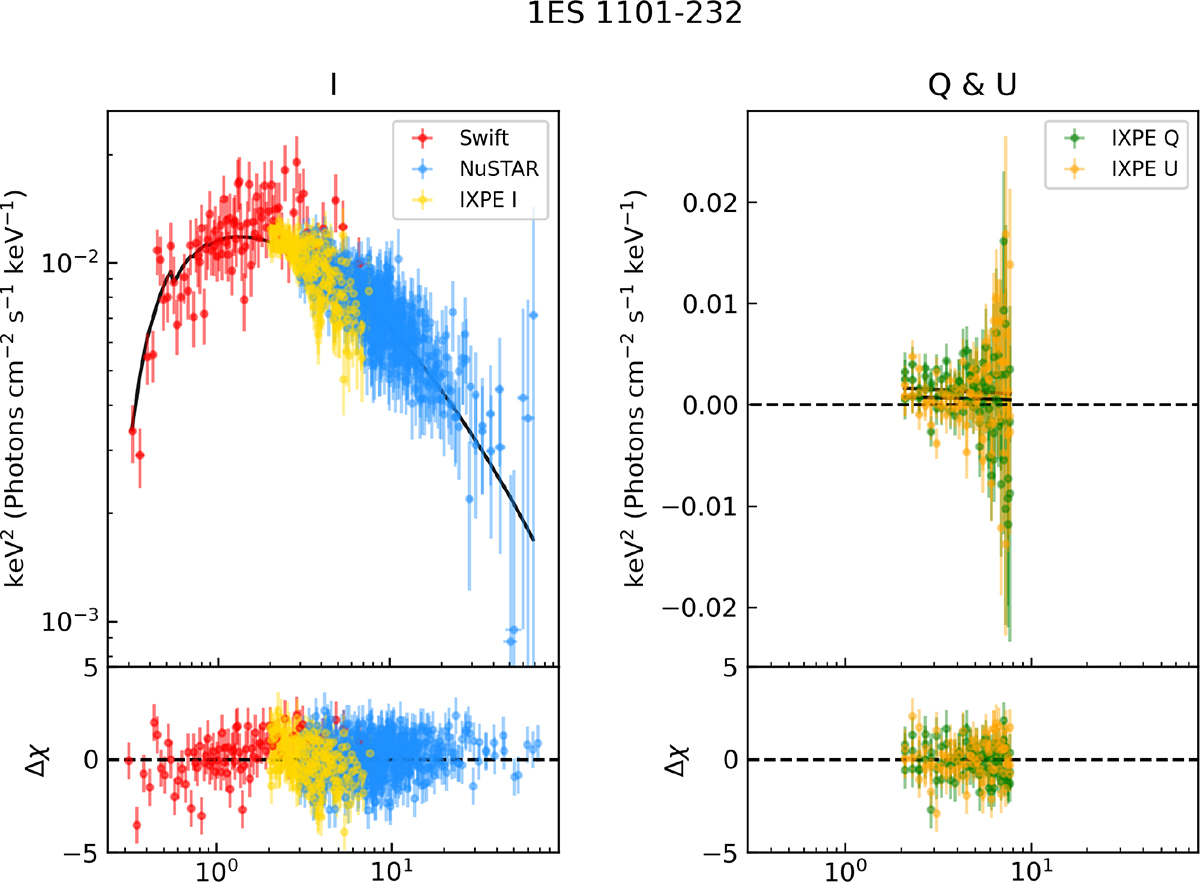
Joint spectropolarimetric analysis of 1ES 1101-232. Left: Energy flux spectra, expressed as photon flux multiplied by energy squared, for the Swift (red), IXPE I (yellow), and NuSTAR (blue) data together with the corresponding data-model residuals. The black line indicates the best-fit model. Right: IXPE Q and U spectra, displayed in green and orange, respectively, together with their deviations from the best-fit model.
Current usage metrics show cumulative count of Article Views (full-text article views including HTML views, PDF and ePub downloads, according to the available data) and Abstracts Views on Vision4Press platform.
Data correspond to usage on the plateform after 2015. The current usage metrics is available 48-96 hours after online publication and is updated daily on week days.
Initial download of the metrics may take a while.