Open Access
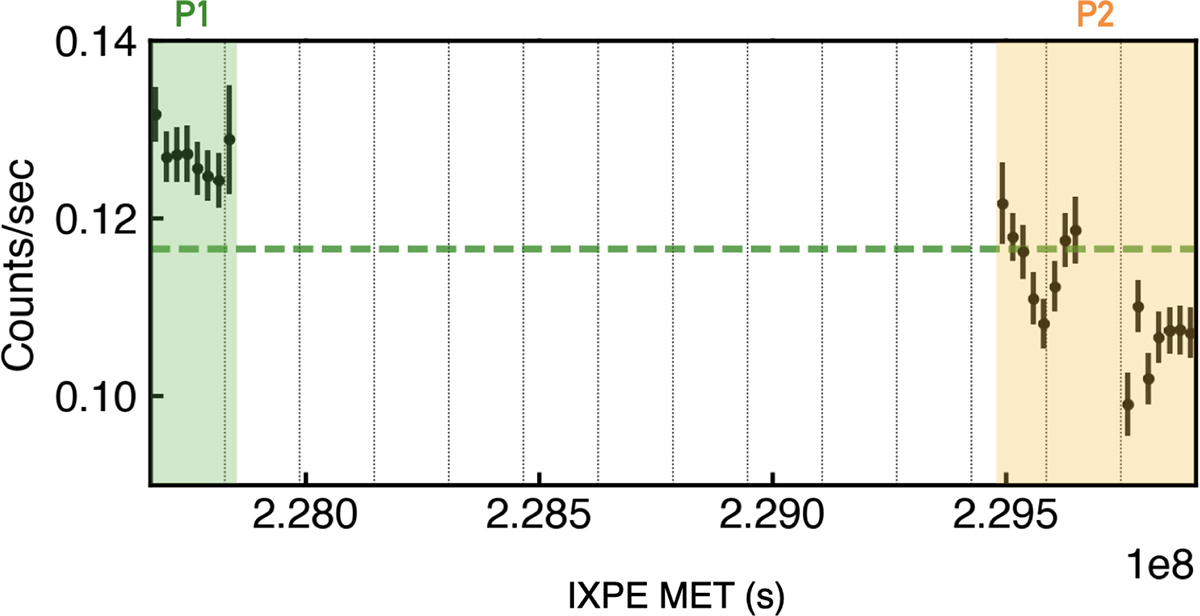
Fig. 2.
Download original image
Light curve of the IXPE observation of RGB J0710+591. The green and orange shaded areas indicate periods one and two, respectively, split according to the central observation gap. The central dashed green line represents the average count rate of RGB J0710+591 during the IXPE observation.
Current usage metrics show cumulative count of Article Views (full-text article views including HTML views, PDF and ePub downloads, according to the available data) and Abstracts Views on Vision4Press platform.
Data correspond to usage on the plateform after 2015. The current usage metrics is available 48-96 hours after online publication and is updated daily on week days.
Initial download of the metrics may take a while.