Fig. 9.
Download original image
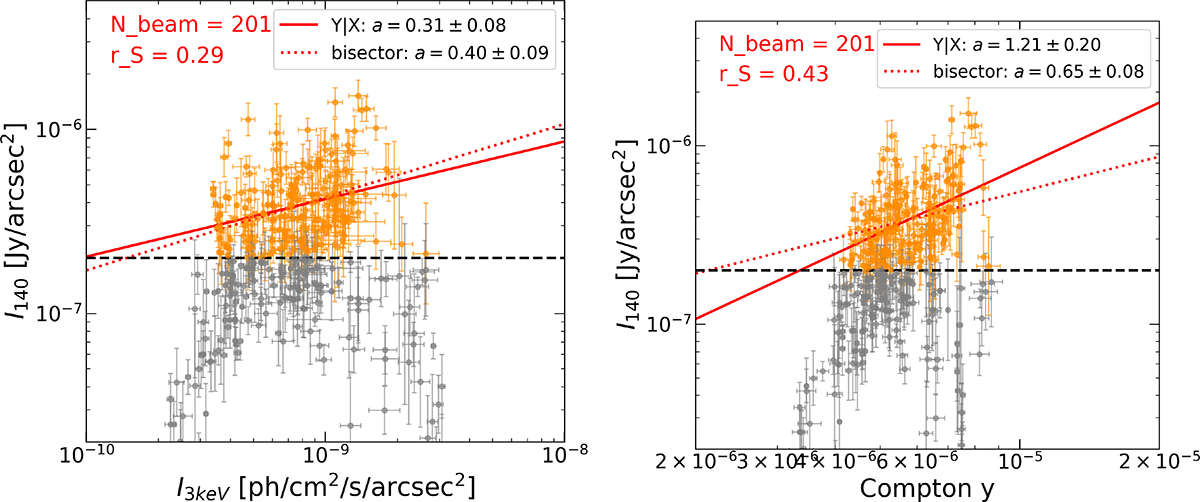
Correlation plots for the radio and X-ray intensities (left panel) and for the radio intensity and the Compton-y parameter (right panel). We study the (1.2 Mpc)2 area shown in Fig. 1. The data points with error bars show the mean values and the standard deviation in the resampled pixels with 64 kpc resolution. The orange points have the 140 MHz intensity greater than the current sensitivity of LOFAR, I140 ≥ 0.2 μJy/arcsec2 (dashed line). The red lines show the best-fit correlations for the orange points calculated with the BCES Y|X (solid line) and bisector (dotted line) methods.
Current usage metrics show cumulative count of Article Views (full-text article views including HTML views, PDF and ePub downloads, according to the available data) and Abstracts Views on Vision4Press platform.
Data correspond to usage on the plateform after 2015. The current usage metrics is available 48-96 hours after online publication and is updated daily on week days.
Initial download of the metrics may take a while.