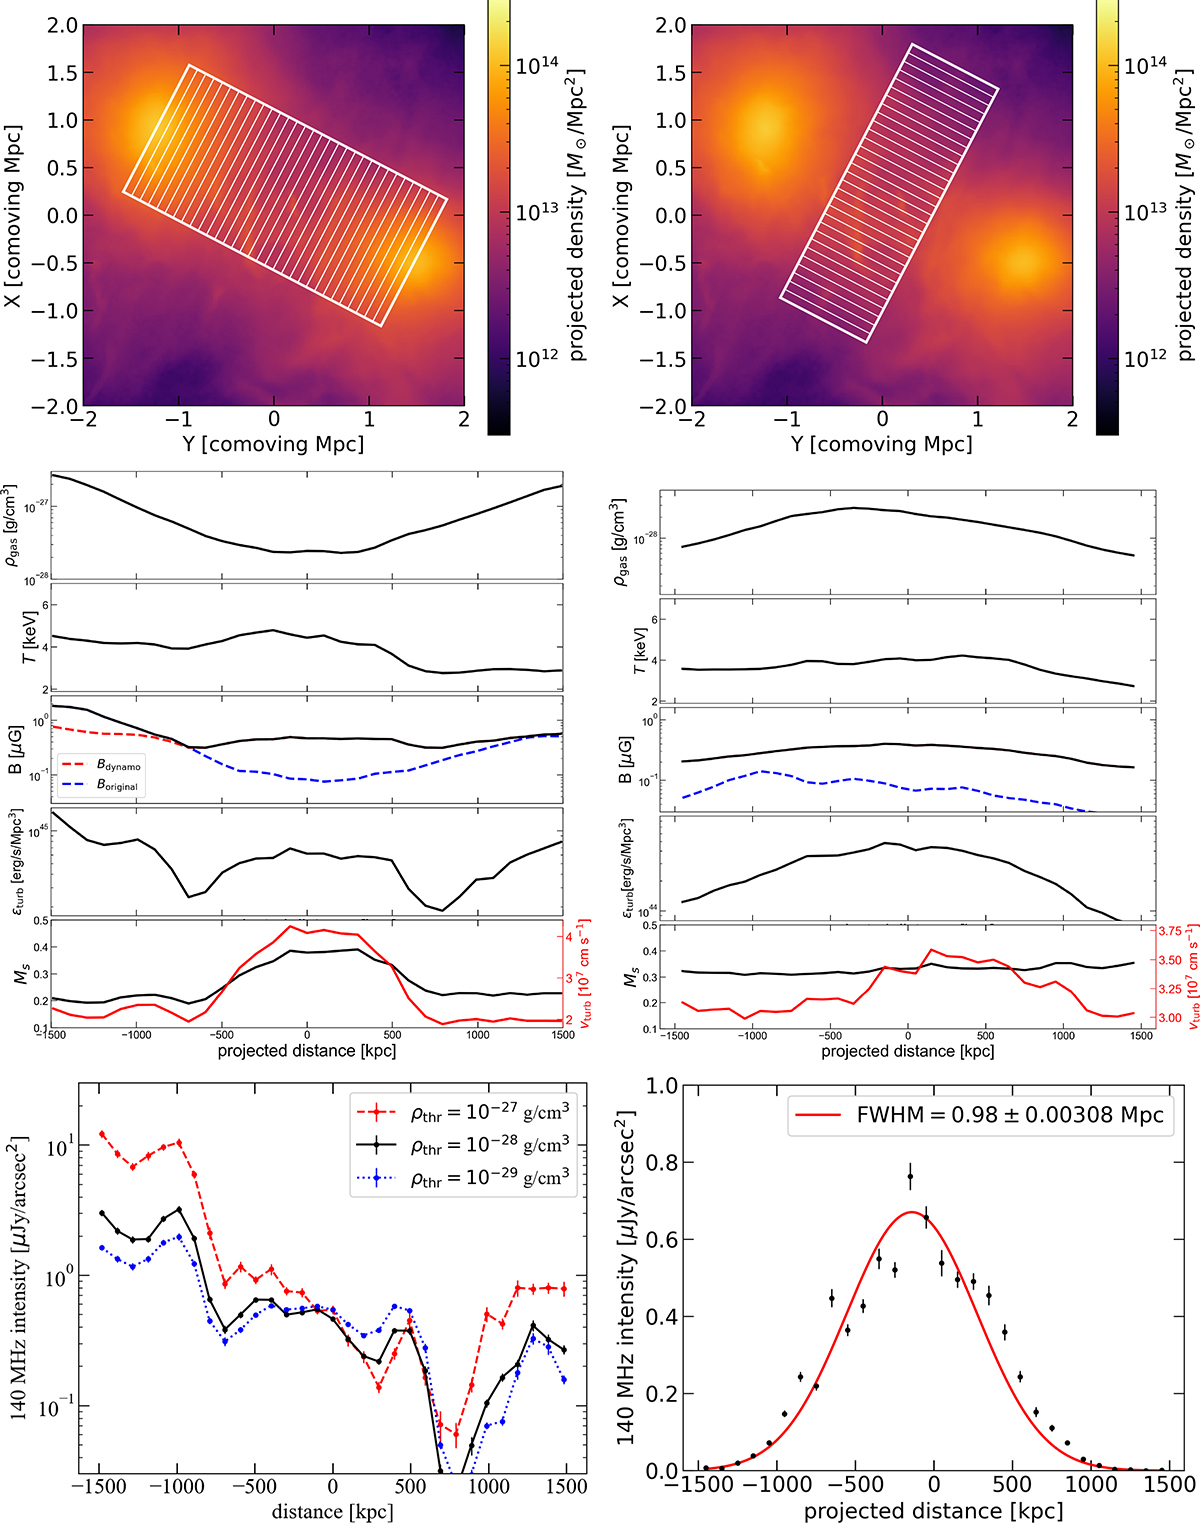
Fig. 8.
Download original image
Profiles of the radio bridge parallel to (left panels) and perpendicular to (right panels) the merger axis. The top row shows the projected gas density map, where the white squares and stripes indicate the regions used to compute the profiles. The second row presents the profiles of gas density, temperature, magnetic field, solenoidal turbulent power per unit volume, and turbulent sonic Mach number together with the turbulent velocity. For the magnetic field, the red dashed line shows the strength estimated with the dynamo model with (L, ηB) = (150 kpc, 0.05), while the blue dashed line shows the magnetic field taken from the original Enzo snapshot. The solid black line indicates the larger value between the two magnetic fields, which is adopted in the FP simulation (Sect. 2.4). In the Mach number panel, the red solid line shows the solenoidal turbulent velocity vturb (right axis). The third row shows the projected radio intensity profile. The error bars represent the 1σ uncertainty of the mean value.
Current usage metrics show cumulative count of Article Views (full-text article views including HTML views, PDF and ePub downloads, according to the available data) and Abstracts Views on Vision4Press platform.
Data correspond to usage on the plateform after 2015. The current usage metrics is available 48-96 hours after online publication and is updated daily on week days.
Initial download of the metrics may take a while.