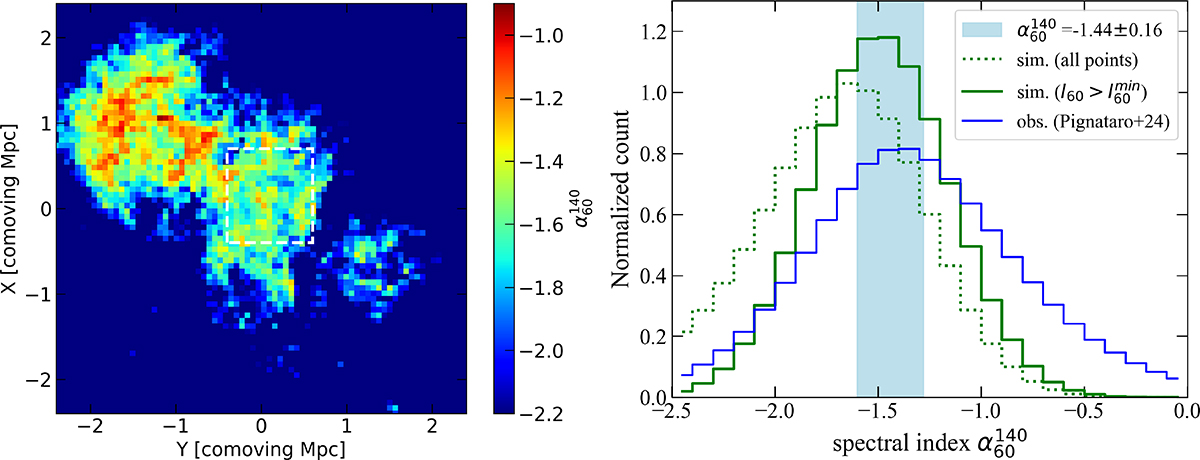
Fig. 7.
Download original image
Synchrotron spectral index between 60 MHz and 140 MHz. Left panel: spectral index map at a spatial resolution of 64 kpc × 64 kpc over a (4.8 comoving Mpc)2 region centered on the radio bridge. The white box indicates the bridge region, identical to that shown in Fig. 1. Right panel: spectral index distribution within the bridge region. The green histograms show the simulation results, where the dotted line corresponds to the unweighted distribution and the solid line to the distribution weighted by the 60 MHz intensity. The blue histogram represents the observed distribution reported by Pignataro et al. (2024a). The shaded blue region indicates the spectral index derived from the integrated flux in the observation. All histograms are normalized to unit area.
Current usage metrics show cumulative count of Article Views (full-text article views including HTML views, PDF and ePub downloads, according to the available data) and Abstracts Views on Vision4Press platform.
Data correspond to usage on the plateform after 2015. The current usage metrics is available 48-96 hours after online publication and is updated daily on week days.
Initial download of the metrics may take a while.