Fig. 6.
Download original image
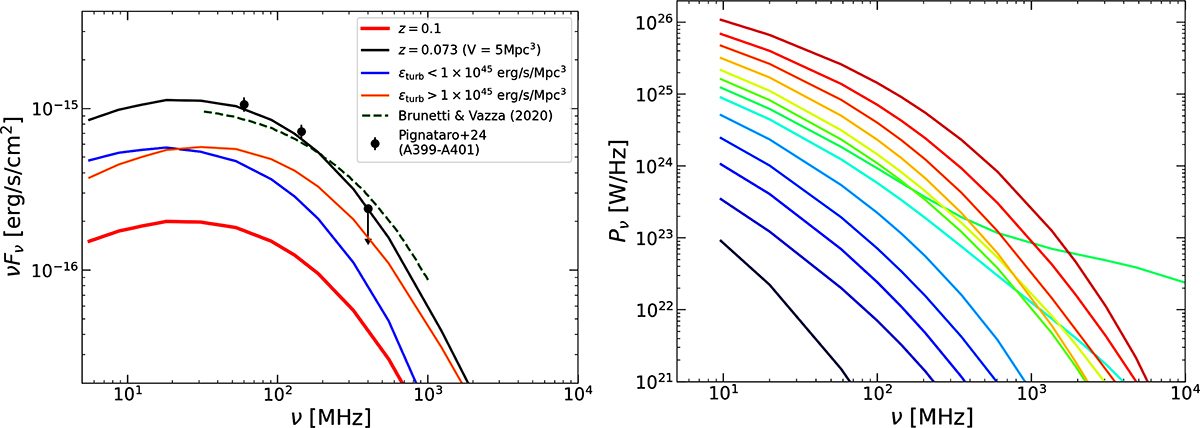
Synchrotron spectrum of the radio bridge. In the left panel, we show the spectrum calculated for the snapshot at z = 0.1. The red and black lines show the flux calculated with the luminosity distances for z = 0.1 and z = 0.073, respectively. The data points with error bars show the flux of A399–A401 bridge measured at LOFAR frequencies, taken from Pignataro et al. (2024a). The orange and blue lines show contribution from regions with volumetric turbulent energy flux larger and smaller than 1 × 1045 erg/s/Mpc3. The green dashed line shows the spectrum calculated by Brunetti & Vazza (2020), adopted from Pignataro et al. (2024b). The right panel shows the evolution of the emitted synchrotron power as a function of frequency. With the colors from blue to red, we plot the evolution from z = 0.2 to z = 0.08 (every Δz = 0.01). In the right panel, the spectra are shown in units of W Hz−1 so that results at different redshifts (i.e., luminosity distance) can be directly compared.
Current usage metrics show cumulative count of Article Views (full-text article views including HTML views, PDF and ePub downloads, according to the available data) and Abstracts Views on Vision4Press platform.
Data correspond to usage on the plateform after 2015. The current usage metrics is available 48-96 hours after online publication and is updated daily on week days.
Initial download of the metrics may take a while.