Open Access
Fig. 4.
Download original image
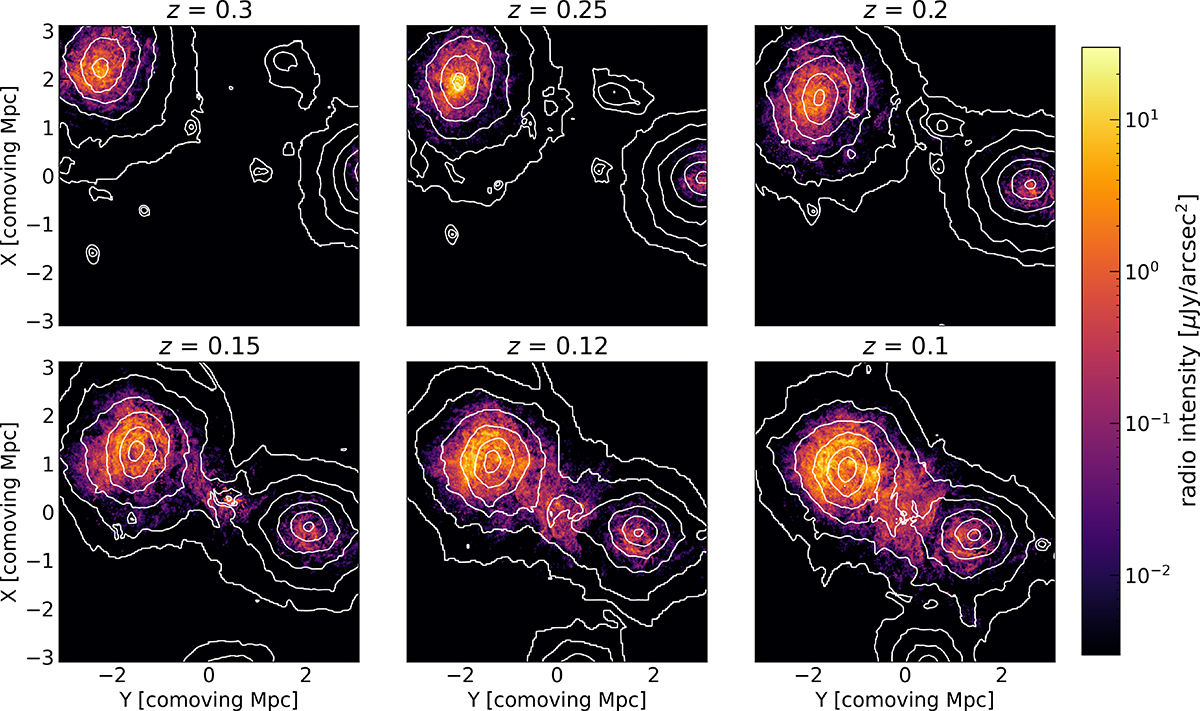
Evolution of the radio intensity map at 140 MHz. The white contour shows the projected gas density at logarithmically spaced eight levels between 3 × 10¹² M⊙/Mpc2 and 2 × 10¹⁴ M⊙/Mpc2. The mesh size of the radio map is 16 (comoving) kpc.
Current usage metrics show cumulative count of Article Views (full-text article views including HTML views, PDF and ePub downloads, according to the available data) and Abstracts Views on Vision4Press platform.
Data correspond to usage on the plateform after 2015. The current usage metrics is available 48-96 hours after online publication and is updated daily on week days.
Initial download of the metrics may take a while.