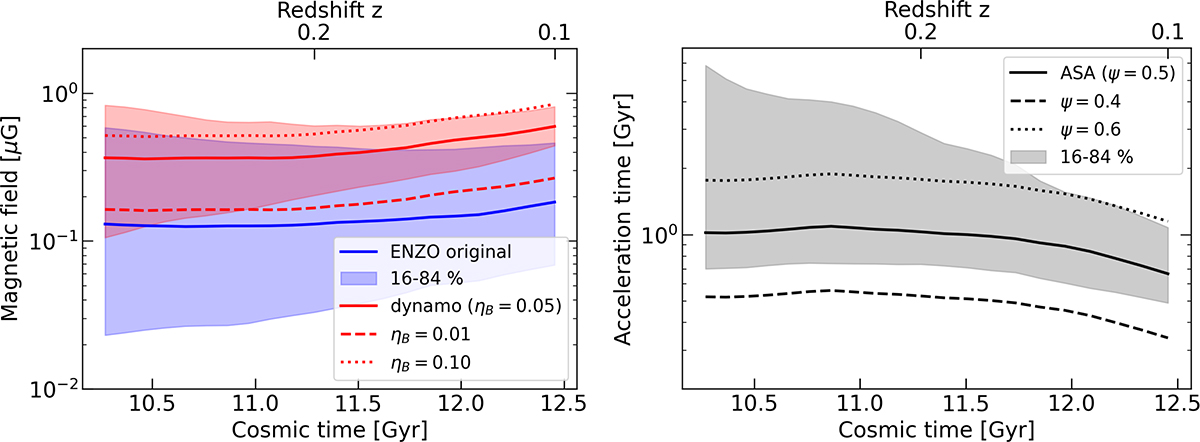
Fig. 2.
Download original image
Time evolution of the magnetic field (left panel) and timescale of reacceleration (right panel) from z = 0.3 to 0.1 along the trajectories of N = 5.1 × 10⁵ tracer particles that end up in the bridge region (white box in Fig. 1). In both panels, the solid line and the shaded region show the median value and 1σ range of the distribution. In the left panel, the red and blue lines show the dynamo magnetic field calculated with ηB = 0.05 and the original magnetic field in the Enzo simulation, respectively. The dashed and dotted lines show the median values for different parameters.
Current usage metrics show cumulative count of Article Views (full-text article views including HTML views, PDF and ePub downloads, according to the available data) and Abstracts Views on Vision4Press platform.
Data correspond to usage on the plateform after 2015. The current usage metrics is available 48-96 hours after online publication and is updated daily on week days.
Initial download of the metrics may take a while.