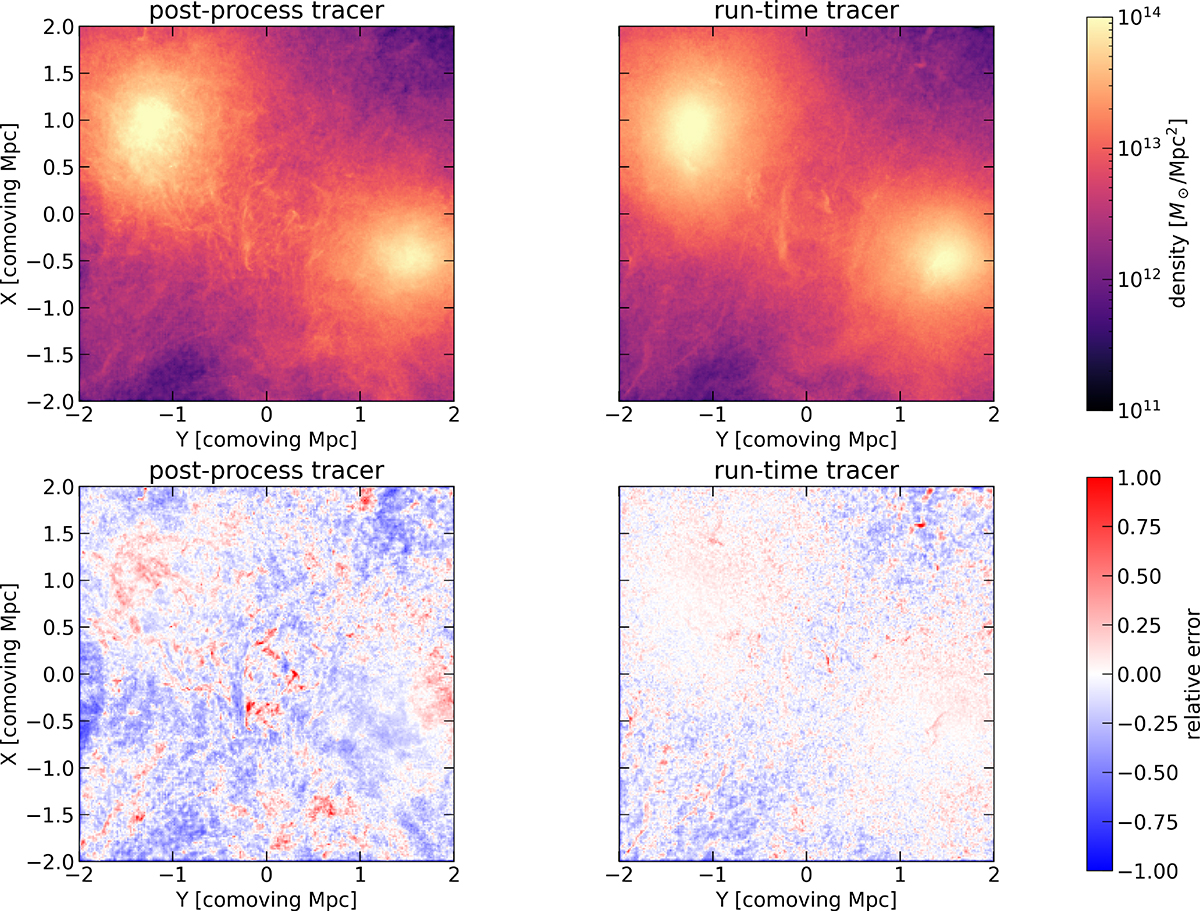
Fig. C.1.
Download original image
Comparison of projected density maps from tracer methods. Upper panels: projected density map calculated with the tracers. The left and right panels show the results for the post-process tracer method adopted in the previous works and the run-time tracer method developed in this work, respectively. Lower panels: the relative error to the original Enzo map.
Current usage metrics show cumulative count of Article Views (full-text article views including HTML views, PDF and ePub downloads, according to the available data) and Abstracts Views on Vision4Press platform.
Data correspond to usage on the plateform after 2015. The current usage metrics is available 48-96 hours after online publication and is updated daily on week days.
Initial download of the metrics may take a while.