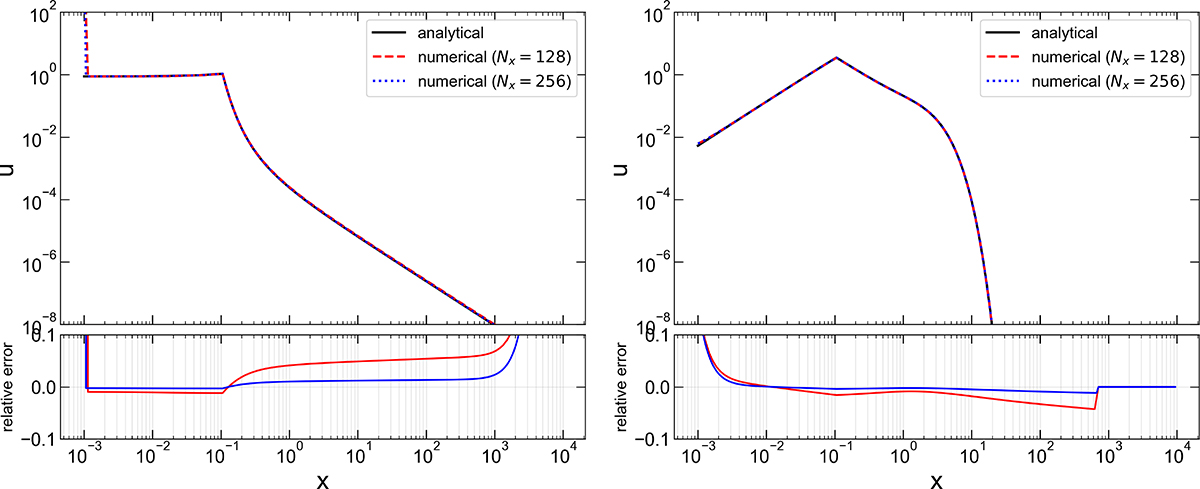
Fig. A.1.
Download original image
Comparison to the analytical solution. Left panel: case for B(x) = − x − 1. Right panel: case for B(x) = − x − x2. The black solid lines show the analytical solutions. The red and blue lines show numerical solutions for different resolutions for x bin: Nx = 128 and 256, respectively. In the lower panels, we show the relative error of the numerical solution to the analytical one.
Current usage metrics show cumulative count of Article Views (full-text article views including HTML views, PDF and ePub downloads, according to the available data) and Abstracts Views on Vision4Press platform.
Data correspond to usage on the plateform after 2015. The current usage metrics is available 48-96 hours after online publication and is updated daily on week days.
Initial download of the metrics may take a while.