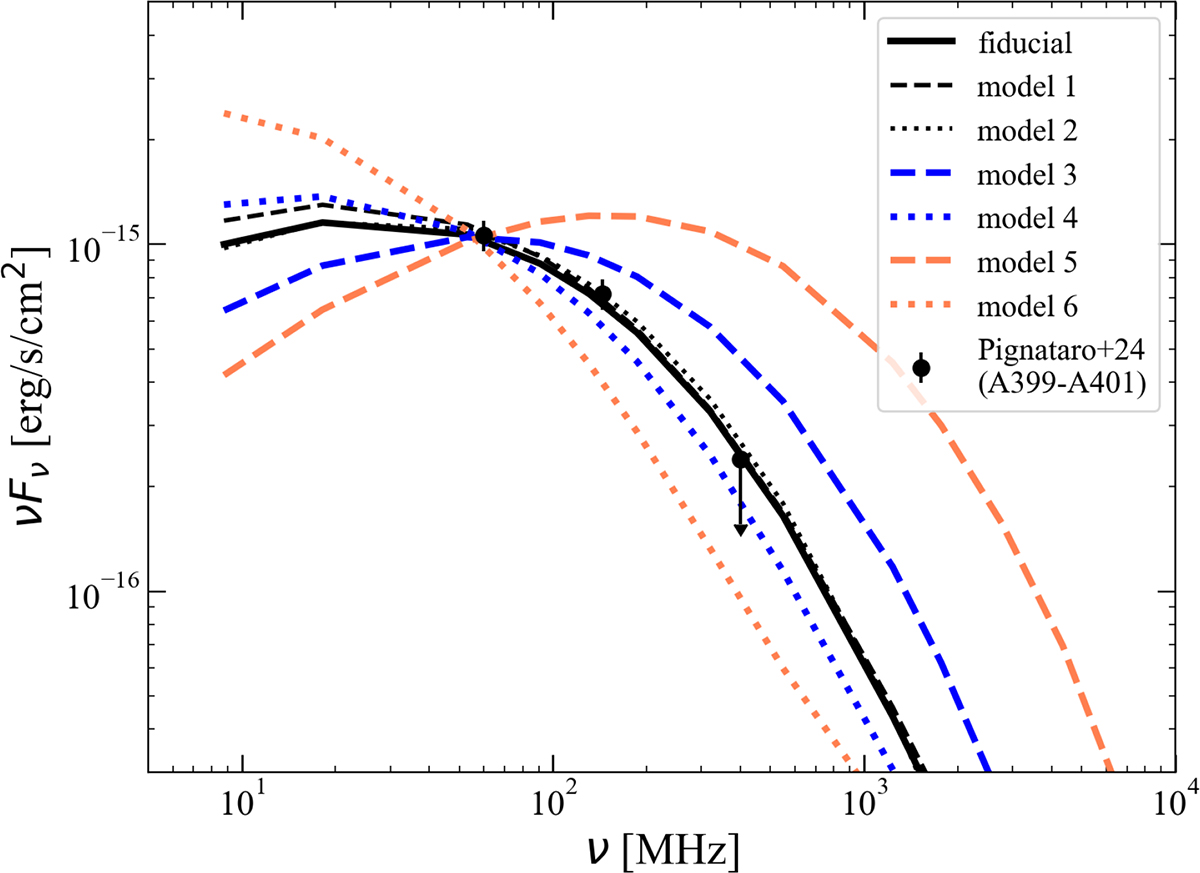
Fig. 11.
Download original image
Spectra of the radio bridge for various models. The solid black line shows the fiducial model presented in Sect. 3. Models 1 and 2 yield spectra that are similar to the fiducial one, shown by the dashed and dotted black lines, respectively. The blue curves correspond to ηB = 0.02 (model 3; dashed) and ηB = 0.08 (model 4; dotted), while the orange curves show the cases with ψ = 0.4 (model 5; dashed) and ψ = 0.6 (model 6; dotted). For comparison, all spectra are normalized to match the 60 MHz radio power of A399–A401. The model parameters are summarized in Table 2.
Current usage metrics show cumulative count of Article Views (full-text article views including HTML views, PDF and ePub downloads, according to the available data) and Abstracts Views on Vision4Press platform.
Data correspond to usage on the plateform after 2015. The current usage metrics is available 48-96 hours after online publication and is updated daily on week days.
Initial download of the metrics may take a while.