Open Access
Fig. 10.
Download original image
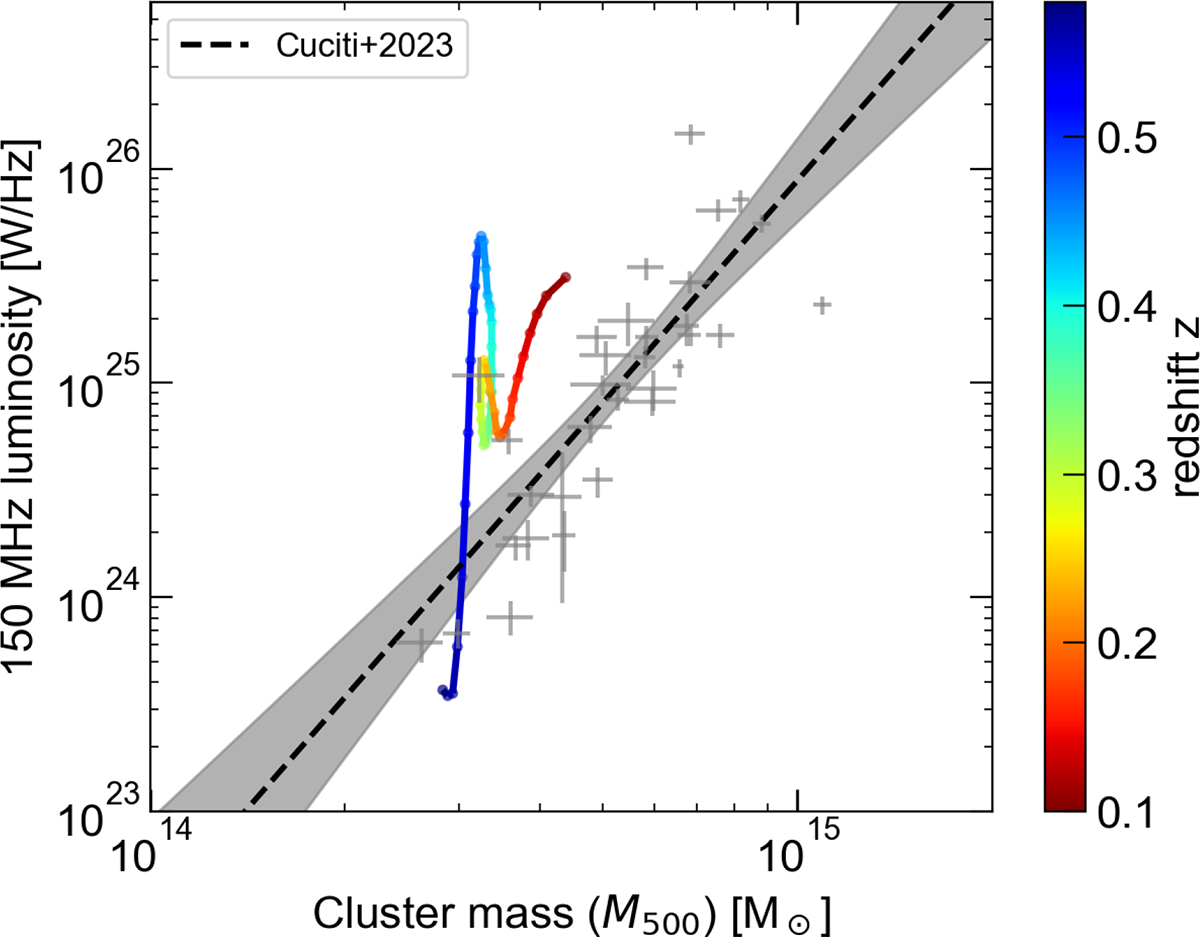
Evolution of the radio power at 150 MHz of the radio halo as a function of the halo mass M500. The color scale indicates the redshift evolution in 0.6 ≤ z ≤ 0.1. The data points and the correlation shown with the dashed line and the shaded region are adopted from Cuciti et al. (2023).
Current usage metrics show cumulative count of Article Views (full-text article views including HTML views, PDF and ePub downloads, according to the available data) and Abstracts Views on Vision4Press platform.
Data correspond to usage on the plateform after 2015. The current usage metrics is available 48-96 hours after online publication and is updated daily on week days.
Initial download of the metrics may take a while.