| Issue |
A&A
Volume 709, May 2026
|
|
|---|---|---|
| Article Number | L4 | |
| Number of page(s) | 8 | |
| Section | Letters to the Editor | |
| DOI | https://doi.org/10.1051/0004-6361/202558334 | |
| Published online | 05 May 2026 | |
Letter to the Editor
The impact of strong feedback on galaxy group scaling relations
1
Department of Astronomy, University of Geneva, Ch. d’Ecogia 16, 1290, Versoix, Switzerland
2
Max-Planck-Institut für Astronomie, Königstuhl 17, D-69117, Heidelberg, Germany
3
Department of Physics, University of Helsinki, Gustaf Hällströmin katu 2, 00560, Helsinki, Finland
4
INAF – IASF Milano, Via Alfonso Corti 12, 20133, Milan, Italy
5
Center for Astrophysics | Harvard & Smithsonian, 60 Garden Street, Cambridge, MA, 02138, USA
6
INAF – Osservatorio di Astrofisica e Scienza dello Spazio di Bologna, Via P. Gobetti 93/3, 40129, Bologna, Italy
7
INFN, Sezione di Bologna, Viale Berti Pichat 6/2, 40127, Bologna, Italy
8
CASA, Department of Astrophysical and Planetary Sciences, University of Colorado, 389 UCB, Boulder, CO, 80309, USA
9
Centre for Astrophysics Research, Department of Physics, Astronomy and Mathematics, University of Hertfordshire, College Lane, Hatfield, AL10 9AB, UK
10
Kavli Institute for Cosmology, University of Cambridge, Madingley Road, Cambridge, CB3 0HA, UK
11
Department of Physics and Astronomy, University of Alabama in Huntsville, Huntsville, AL, 35899, USA
12
Department of Computer Science, Aalto University, PO Box 15400, Espoo, FI-00 076, Finland
13
Departamento de Física Teórica, M-8, Universidad Autónoma de Madrid, Cantoblanco, E-28049, Madrid, Spain
14
Centro de Investigación Avanzada en Física Fundamental (CIAFF), Universidad Autónoma de Madrid, Cantoblanco, E-28049, Madrid, Spain
15
Institute for Astronomy, University of Edinburgh, Royal Observatory, Edinburgh, EH9 3HJ, United Kingdom
16
Centre for Radio Astronomy Techniques and Technologies, Department of Physics and Electronics, Rhodes University, PO Box 94, Makhanda, 6140, South Africa
17
South African Radio Astronomy Observatory, Black River Park North, 2 Fir St, Cape Town, 7925, South Africa
18
School of Physics and Astronomy, University of Birmingham, Birmingham, B152TT, UK
★ Corresponding author: This email address is being protected from spambots. You need JavaScript enabled to view it.
Received:
1
December
2025
Accepted:
14
March
2026
Abstract
Feedback from active supermassive black holes alters the distribution of matter in the Universe by injecting energy in the neighbouring hot gaseous medium, which leads to ejection of gas from the halos of galaxy groups and massive galaxies. Recent cosmological simulations such as FLAMINGO calibrate their feedback model on the baryon fractions of galaxy groups to tune the efficiency of gas ejection. However, recent observational constraints from optically selected groups and the kinetic Sunyaev–Zel’dovich effect yield lower baryon fractions than previous studies, which indicates that feedback may be more ejective than previously thought. In this work, we confirm that the scaling relations of local galaxy groups in the mass range 1013 − 1014 M⊙ favour the fiducial FLAMINGO feedback calibration. We study the X-ray luminosity–temperature relation in a sample of 44 galaxy groups with high-quality XMM-Newton observations. We show that highly ejective models under-predict the luminosity of galaxy groups at fixed mass at high significance (5.7σ). This discrepancy cannot be explained by selection effects and is obtained from directly measurable and minimally correlated quantities. We point out that turning observable quantities into gas fraction estimates is challenging, especially in the context of stacking large samples of heterogeneous systems. We argue that validating feedback models against observable scaling relations is necessary to warrant the validity of feedback implementations in cosmological simulations.
Key words: galaxies: active / galaxies: groups: general / large-scale structure of Universe
© The Authors 2026
 Open Access article, published by EDP Sciences, under the terms of the Creative Commons Attribution License (https://creativecommons.org/licenses/by/4.0), which permits unrestricted use, distribution, and reproduction in any medium, provided the original work is properly cited.
This article is published in open access under the Subscribe to Open model. This email address is being protected from spambots. You need JavaScript enabled to view it. to support open access publication.
1. Introduction
Feedback from active galactic nuclei (AGN) is a necessary ingredient in galaxy evolution models, as it regulates the star formation in massive galaxies and reproduces the shape of the galaxy stellar mass function (e.g. Silk & Rees 1998). However, implementation of this feedback differs substantially from one simulation to another, and various combinations of sub-grid parameters can yield similar stellar mass functions (e.g. Schaye et al. 2023). In contrast, the feedback models make distinct predictions for the heating of the hot atmospheres of massive halos (McCarthy et al. 2010). Galaxy groups in the mass range M500 ∼ 1013 − 1014 M⊙ are particularly sensitive to feedback, as the total AGN energy input rivals or even exceeds the gas binding energy (Eckert et al. 2021), which leads to gas ejection from the halo and sub-cosmic baryon fractions. As such, the efficiency of gas ejection can be tuned by calibrating the feedback models to match the fraction of baryons remaining within the halos (McCarthy et al. 2017; Henden et al. 2018). In turn, these simulations can be used to predict the impact of baryonic feedback on the matter distribution on cosmological scales, which represents a leading source of systematic uncertainty for upcoming cosmological surveys (Chisari et al. 2019).
While tuning the feedback model to reproduce the gas fractions of galaxy groups provides an effective way of implementing gas ejection within simulations, the resulting predictions require the calibration datasets to be highly accurate. In particular, the fiducial FLAMINGO model for baryonic feedback was calibrated on an heterogeneous collection of gas fraction measurements (e.g. Sun et al. 2009; Lovisari et al. 2015; Akino et al. 2022). In many cases, the halo masses were estimated while assuming hydrostatic equilibrium (HSE), which is likely biased in dynamically active systems (e.g. Gianfagna et al. 2021). Moreover, X-ray surveys preferentially select the brightest, gas-rich systems. For this reason, the FLAMINGO suite includes multiple runs from the same initial condition with different feedback strengths, tuned to reproduce the mean fgas − M500 relation of clusters with M500 ≳ 1014 M⊙ as well as variants offset by +2σ (weaker feedback), −2σ, −4σ, and −8σ (stronger feedback).
The general understanding of gas ejection in massive halos has been rapidly evolving recently. For instance, the eROSITA all-sky survey has detected hundreds of galaxy groups (Bahar et al. 2024; Siegel et al. 2025). Stacking of optically selected systems also provides an alternative view of the gas content of groups that is independent of X-ray selection (Comparat et al. 2022; Popesso et al. 2024, 2025; Zhang et al. 2024). Independent constraints have also been obtained from the kinetic Sunyaev–Zel’dovich (kSZ) effect for halos of lower masses and higher redshifts (Schaan et al. 2021; Ried Guachalla et al. 2025; Hadzhiyska et al. 2025; Lucie-Smith et al. 2025). These recent results seem to imply efficient gas ejection from group-scale halos and lower gas fractions than previously thought in the group mass range. When combining these measurements with galaxy–galaxy lensing estimates, it was shown that the latest measurements are consistent with the FLAMINGO models with the strongest feedback (fgas−8σ, McCarthy et al. 2025; Siegel et al. 2025). If confirmed, these results would imply a marked suppression of the matter power spectrum on ≲1 Mpc scales (Bigwood et al. 2024).
In this work, we study the X-ray luminosity-temperature relation in a sample of 44 nearby galaxy groups from the XMM-Newton Group AGN Project (X-GAP, Eckert et al. 2024). We then compare the retrieved LX − T relation with the predictions of FLAMINGO simulations with varying feedback. Throughout the paper, we assume a concordance cosmology with H0 = 67.8 km/s/Mpc and Ωm = 0.3075 (Planck Collaboration XIII 2016).
2. The X-GAP sample
X-GAP (Eckert et al. 2024)1 is a sample of 49 galaxy groups selected from the All-sky X-ray Extragalactic Sources sample (AXES-SDSS; Damsted et al. 2024). AXES was selected by cross-correlating spectroscopic galaxy groups from the Sloan Digital Sky Survey (SDSS) with at least five member galaxies (Tempel et al. 2017) with weak extended X-ray sources from the ROSAT all-sky survey. Seppi et al. (2025, hereafter S25) studied the selection function of the sample through detailed semi-analytic simulations and showed that the survey selection closely resembles an X-ray flux selection with a flux limit of ∼10−12 erg/cm2/s in the 0.1–2.4 keV band. Unlike usual X-ray samples, the cross-correlation with optical groups does not preferentially select centrally peaked systems. X-GAP was then selected as a complete sub-sample of AXES with the following criteria: i)z ≤ 0.05; ii) number of galaxies greater than eight; iii)R500 smaller than 15 arcmin. The third criterion can be written as an upper bound on the group luminosity, which reads
 (1)
(1)
These criteria yielded a sample of 45 groups in the mass range 1013 − 1014 M⊙, all of which were followed up with XMM-Newton to obtain at least 20 000 net source counts per group (proposal ID 090389). The final sample includes four additional systems in the redshift range 0.05 − 0.06 with similar observational depth. These four systems do not formally fulfil the selection criteria, and thus we do not consider them here. Finally, for one system, SDSSTG 16386, the association with the X-ray source was found to be incorrect, and the optical group is likely spurious. The detected ROSAT source matches another group at a slightly higher redshift (SDSSTG 24595 at z = 0.058). Finding one such source is not surprising, as the purity of the optical group finder is about 65% (see S25). Our final selection contains 44 systems, which represents a complete sub-sample of AXES given the above criteria.
The XMM-Newton data were homogeneously analysed using the procedure described in Eckert et al. (2025), which is outlined in Appendices A and B. The median temperature of the sample is 1.13 keV, with 16th and 84th percentiles of 0.86 and 1.82 keV.
3. Results
3.1. Luminosity–temperature and luminosity–mass relations
In Fig. 1 we plot the luminosity–mass (LX − M) and luminosity-temperature (LX − T) relations for the 44 groups that strictly match the selection criteria. For the LX − M relation, we only consider the systems with direct HSE masses (see Sect. B), whereas the LX − T plot includes all systems.
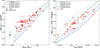 |
Fig. 1. Luminosity–mass (left) and luminosity–temperature (right) relations for X-GAP groups (colored symbols, see Table D.1). The solid curves show the relations obtained in various FLAMINGO runs (see B24). In the left-hand panel, the black diamonds show the luminosity–mass relation of optically selected groups in the eFEDS field (Popesso et al. 2025). |
We compared our results with the LX − M relation obtained by stacking optically selected groups in the eFEDS field (Popesso et al. 2025). Importantly, our LX − M relation agrees with the relation retrieved from eROSITA stacks. The optical selection is expected to be more complete, albeit less pure, than our optical/X-ray matching technique (S25). This demonstrates that, on average, X-GAP groups are not over-luminous for their mass. For comparison, we plotted the LX − M relations obtained for FLAMINGO simulations with varying feedback (Braspenning et al. 2024, hereafter B24). We considered only the nominal thermal feedback model whereby the energy injected by AGN is distributed isotropically by raising the temperature of neighbouring particles (Booth & Schaye 2009). A full comparison between the properties of X-GAP and the FLAMINGO predictions is deferred to a subsequent paper (Seppi et al., in prep.).
One can see that the LX − M relation of the X-GAP groups agrees with the fiducial FLAMINGO run (L1_m9), whereas all the groups lie above the FLAMINGO fgas−8σ curve. However, the LX − M relation is highly sensitive to the accuracy of the halo mass estimates such that an under-estimation of the halo masses may yield a better agreement with the strong feedback models. For this reason, we focused our analysis on the LX − T relation, which is essentially insensitive to mass estimates. The X-GAP LX − T relation agrees with the FLAMINGO fiducial run and is strongly discrepant with the models with the strongest feedback. At 1 keV (∼3 × 10¹³ M⊙), the median luminosity of the X-GAP groups exceeds the prediction of the fgas−8σ run by about 0.5 dex. This indicates that this run overly reduces the gas content in the inner regions (≲0.5R500), leading to lower X-ray luminosities at fixed temperature. None of the groups fall below the median of the fgas−8σ run, although a few objects at the high-temperature end seem to favour a slightly stronger feedback than the fiducial run. On average, only ∼15% of the measured luminosity originates from the core (< 0.15R500) such that this conclusion is not driven exclusively by the behaviour of the inner regions.
3.2. Modelling selection effects
A key point in the comparison between the X-GAP groups and the FLAMINGO predictions is the potential impact of selection effects on our sample. In case our selection procedure preferentially includes X-ray bright systems and misses an important population of low-luminosity systems, the LX − T and LX − M relations of the selected systems will be biased with respect to the mean relation.
To assess the impact of sample selection on the retrieved scaling relations, we ran Monte-Carlo simulations to study the expected properties of the selected samples in the various FLAMINGO runs. We drew objects from the halo mass function, generated observable properties given the median relations and their intrinsic scatter (B24), and applied the survey selection function calibrated in S25 from full SDSS and RASS mocks. We used the public code colossus (Diemer 2018) to compute the halo mass function, and randomly drew halo masses within an area equivalent to SDSS (7480 deg2) and the redshift range of interest (0.01 < z < 0.05). We then assigned a luminosity and a temperature to each halo using the FLAMINGO scaling relations, assuming a log-normal intrinsic scatter. We applied an upwards correction of 0.1 dex to the luminosities to account for the contribution of projected gas along the line of sight, which corresponds to the projected contribution of a beta-model with β = 0.4 (typical of galaxy groups, e.g., Spinelli et al. 2025). Finally, we used the AXES selection function to calculate the detection probability, and populate the selected sample through rejection sampling. We then applied the X-GAP selection criteria (see Sect. 2 and Eq. (1)) to extract mock X-GAP-like samples.
For each FLAMINGO run, we repeated the exercise 10 000 times to study the variance in the properties of the selected samples. We found that the properties of the mock X-GAP-like samples strongly depend on the feedback parameters. Most notably, the median temperature of the selected groups,  , and the number of objects in the sample, Ndet, vary strongly from one model to another. The median luminosity does not change much, as the luminosity range is set by the sample selection criteria. In Fig. 2 we show the values of
  (left) and Ndet (right) for the various FLAMINGO runs. For the fiducial run, we approximately predicted the right number of groups (40 ± 6) and the right temperature (1.21 ± 0.07 keV) compared to the real X-GAP sample. Runs with stronger feedback tend to under-predict the number of selected groups, as the lower luminosity at fixed mass implies that our luminosity range corresponds to more massive systems, which are rarer. For the same reason, these runs over-predict
  . In particular, the run with the strongest feedback (fgas−8σ) predicts that our selection criteria should yield
  groups with
  keV. We used the distributions of
  and Ndet to quantify the discrepancy between the predictions of the FLAMINGO fgas−8σ run and the properties of X-GAP. We found that the two indicators are uncorrelated, and thus the resulting probabilities can be readily combined. Together, the two indicators are discrepant with the FLAMINGO fgas−8σ run at the 5.7σ level. While this conclusion awaits further validation from a full comparison of FLAMINGO halos with X-GAP systems (Seppi et al., in prep.), including an assessment of cosmic variance, this result shows that the X-GAP sample is weakly sensitive to selection effects.
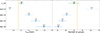 |
Fig. 2. Predicted median temperatures (left) and number of selected groups (right) for FLAMINGO runs with varying feedback. Each data point shows the median and 16th and 84th percentiles of simulated X-GAP-like mock samples. The orange vertical lines show the median temperature and the number of selected groups in the observed X-GAP sample. The numbers on top indicate the statistical significance of the difference with the data. |
4. Discussion and conclusion
The comparison between the X-GAP LX − M and LX − T relations and the FLAMINGO predictions shows that the models with the strongest feedback are in strong tension with the properties of local galaxy groups, in agreement with the original FLAMINGO calibration (Kugel et al. 2023, B24). This is an important conclusion, as the FLAMINGO fgas−8σ model was found to be in good agreement with the gas fractions of eROSITA groups and the kSZ signal (Siegel et al. 2025). In contrast, we find that the FLAMINGO models involving highly ejective feedback yield groups that are too devoid of gas in their inner regions, which leads to substantially lower X-ray luminosities at a fixed mass or temperature. This conclusion holds even when sample selection is taken into account (see Sect. 3.2). Models that are not overly ejective are required to broaden the gas distribution without overly reducing the X-ray luminosities (e.g. Bigwood et al. 2025). Alternatively, the FLAMINGO model may not exactly reproduce the true mass and redshift trends, which may still reconcile our results with the kSZ data.
We note that the luminosities predicted by simulations are affected by uncertainties in supernova yields and metal production, which impacts the estimate of the cooling function. However, B24 showed that FLAMINGO metallicities are substantially over-estimated, such that the predicted luminosities at fixed gas fraction are over-estimated. A lower and more realistic metallicity would decrease the FLAMINGO luminosities and further increase the discrepancy with the X-GAP LX − T relation.
We point out that the inconsistency between the X-GAP LX − T relation and the FLAMINGO fgas−8σ run involves minimal assumptions on the observables. The integrated luminosities and temperatures are both directly observable quantities, and the two measurements are minimally correlated. The two quantities depend on the estimated halo mass only through the integration aperture R500. If the retrieved apertures are slightly underestimated, a larger integration aperture would increase the luminosities, as more flux would be included, and decrease the temperatures, as the outer regions tend to be cooler. Thus, any mass bias would move the points in the opposite direction and increase the discrepancy. The other potential sources of systematics in the measurements are very small. The spectroscopic X-ray temperatures of 1–2 keV systems should be close to the true mass-weighted value, as the bremsstrahlung cut-off falls well within the classical X-ray bandpass and the Fe-L complex acts as a temperature calibrator. Regarding the luminosity, it is the most direct observable, and the associated systematics are minimal. The uncertainties associated with absolute flux calibration, H0 value, and projection effects amount at most to 0.1 dex, which is much less than the differences observed here.
The same cannot be said of the gas fraction measurements, especially when they are derived by stacking large samples of heterogeneous systems. Substantial systematics are associated with the estimate of halo masses, which is not a direct observable of any survey. The gas mass of group-scale systems is also difficult to retrieve, as the emissivity of ∼1 keV plasma is highly sensitive to the metal abundance profile (Lovisari et al. 2021). Within a single system, temperature and metallicity gradients can lead to emissivity variations by a factor of three for a fixed emission measure, which implies uncertainties of ∼30% on the retrieved gas mass. Moreover, a substantial fraction (∼30%, Robotham et al. 2011, S25) of optically selected groups are expected to be loose aggregations of galaxies that have not yet virialised within a common gravitational well, such that their intragroup medium is yet to be heated to X-ray emitting temperatures and the corresponding gas mass may be underestimated. Finally, the strong statistical anti-correlation between gas fraction and halo mass implies that small systematic effects propagate in a non-linear way to the estimated gas fraction at a fixed mass.
Together, the systematic uncertainties highlighted above easily amount to a factor of two in the exact gas fraction of galaxy groups of M500 ∼ 3 × 10¹³ M⊙, and therefore the gas fraction of these systems remains largely unknown. We argue that observable scaling relations provide a robust benchmark to calibrate the impact of AGN feedback on the hot atmospheres of galaxy groups, as these measurements do not rely on our knowledge of the underlying halo mass. Figure 1 highlights the sensitivity of the LX − T relation to the feedback model, as small differences in gas fractions translate into strong discrepancies in the predicted luminosities at fixed temperature. Core-excised quantities can also provide more direct proxies of gas ejection in group outskirts, as they avoid the complexity of the inner regions where cooling losses are important.
Acknowledgments
Based on observations obtained with XMM-Newton, an ESA science mission with instruments and contributions directly funded by ESA Member States and NASA. DE and RS acknowledge support from the Swiss National Science Foundation (SNSF) under grant agreement 200021_212576. LL acknowledges support from INAF grant 1.05.12.04.01. MAB is supported by a UKRI Stephen Hawking Fellowship (EP/X04257X/1).
References
- Akino, D., Eckert, D., Okabe, N., et al. 2022, PASJ, 74, 175 [NASA ADS] [CrossRef] [Google Scholar]
- Bahar, Y. E., Bulbul, E., Ghirardini, V., et al. 2024, A&A, 691, A188 [NASA ADS] [CrossRef] [EDP Sciences] [Google Scholar]
- Bigwood, L., Amon, A., Schneider, A., et al. 2024, MNRAS, 534, 655 [NASA ADS] [CrossRef] [Google Scholar]
- Bigwood, L., Bourne, M. A., Iršič, V., Amon, A., & Sijacki, D. 2025, MNRAS, 542, 3206 [Google Scholar]
- Booth, C. M., & Schaye, J. 2009, MNRAS, 398, 53 [Google Scholar]
- Braspenning, J., Schaye, J., Schaller, M., et al. 2024, MNRAS, 533, 2656 [NASA ADS] [CrossRef] [Google Scholar]
- Chisari, N. E., Mead, A. J., Joudaki, S., et al. 2019, Open J. Astrophys., 2, 4 [NASA ADS] [CrossRef] [Google Scholar]
- Comparat, J., Truong, N., Merloni, A., et al. 2022, A&A, 666, A156 [NASA ADS] [CrossRef] [EDP Sciences] [Google Scholar]
- Damsted, S., Finoguenov, A., Lietzen, H., et al. 2024, A&A, 690, A52 [NASA ADS] [CrossRef] [EDP Sciences] [Google Scholar]
- Diemer, B. 2018, ApJS, 239, 35 [NASA ADS] [CrossRef] [Google Scholar]
- Eckert, D., Finoguenov, A., Ghirardini, V., et al. 2020, Open J. Astrophys., 3, 12 [NASA ADS] [CrossRef] [Google Scholar]
- Eckert, D., Gaspari, M., Gastaldello, F., Le Brun, A. M. C., & O’Sullivan, E. 2021, Universe, 7, 142 [NASA ADS] [CrossRef] [Google Scholar]
- Eckert, D., Ettori, S., Pointecouteau, E., van der Burg, R. F. J., & Loubser, S. I. 2022, A&A, 662, A123 [NASA ADS] [CrossRef] [EDP Sciences] [Google Scholar]
- Eckert, D., Gastaldello, F., O’Sullivan, E., Finoguenov, A., & Brienza, M. 2024, Galaxies, 12, 24 [NASA ADS] [CrossRef] [Google Scholar]
- Eckert, D., Gastaldello, F., Lovisari, L., et al. 2025, A&A, 701, A127 [NASA ADS] [CrossRef] [EDP Sciences] [Google Scholar]
- Gianfagna, G., De Petris, M., Yepes, G., et al. 2021, MNRAS, 502, 5115 [NASA ADS] [CrossRef] [Google Scholar]
- Giles, P. A., Maughan, B. J., Pacaud, F., et al. 2016, A&A, 592, A3 [NASA ADS] [CrossRef] [EDP Sciences] [Google Scholar]
- Hadzhiyska, B., Ferraro, S., Ried Guachalla, B., et al. 2025, Phys. Rev. D, 112, 083509 [Google Scholar]
- Henden, N. A., Puchwein, E., Shen, S., & Sijacki, D. 2018, MNRAS, 479, 5385 [CrossRef] [Google Scholar]
- Kugel, R., Schaye, J., Schaller, M., et al. 2023, MNRAS, 526, 6103 [NASA ADS] [CrossRef] [Google Scholar]
- Lovisari, L., Reiprich, T. H., & Schellenberger, G. 2015, A&A, 573, A118 [NASA ADS] [CrossRef] [EDP Sciences] [Google Scholar]
- Lovisari, L., Ettori, S., Gaspari, M., & Giles, P. A. 2021, Universe, 7, 139 [NASA ADS] [CrossRef] [Google Scholar]
- Lucie-Smith, L., Peiris, H. V., Pontzen, A., et al. 2025, Phys. Rev. D, 112, 063541 [Google Scholar]
- McCarthy, I. G., Schaye, J., Ponman, T. J., et al. 2010, MNRAS, 406, 822 [NASA ADS] [Google Scholar]
- McCarthy, I. G., Schaye, J., Bird, S., & Le Brun, A. M. C. 2017, MNRAS, 465, 2936 [Google Scholar]
- McCarthy, I. G., Amon, A., Schaye, J., et al. 2025, MNRAS, 540, 143 [Google Scholar]
- Munari, E., Biviano, A., Borgani, S., Murante, G., & Fabjan, D. 2013, MNRAS, 430, 2638 [Google Scholar]
- Planck Collaboration XIII. 2016, A&A, 594, A13 [NASA ADS] [CrossRef] [EDP Sciences] [Google Scholar]
- Popesso, P., Marini, I., Dolag, K., et al. 2025, A&A, 704, A278 [NASA ADS] [CrossRef] [EDP Sciences] [Google Scholar]
- Popesso, P., Biviano, A., Marini, I., et al. 2026, A&A, 707, A362 [NASA ADS] [CrossRef] [EDP Sciences] [Google Scholar]
- Ried Guachalla, B., Schaan, E., Hadzhiyska, B., et al. 2025, Phys. Rev. D, 112, 103512 [Google Scholar]
- Robotham, A. S. G., Norberg, P., Driver, S. P., et al. 2011, MNRAS, 416, 2640 [NASA ADS] [CrossRef] [Google Scholar]
- Rossetti, M., Eckert, D., Gastaldello, F., et al. 2024, A&A, 686, A68 [NASA ADS] [CrossRef] [EDP Sciences] [Google Scholar]
- Schaan, E., Ferraro, S., Amodeo, S., et al. 2021, Phys. Rev. D, 103, 063513 [NASA ADS] [CrossRef] [Google Scholar]
- Schaye, J., Kugel, R., Schaller, M., et al. 2023, MNRAS, 526, 4978 [NASA ADS] [CrossRef] [Google Scholar]
- Seppi, R., Eckert, D., Finoguenov, A., et al. 2025, A&A, 699, A206 [NASA ADS] [CrossRef] [EDP Sciences] [Google Scholar]
- Siegel, J., Amon, A., McCarthy, I. G., et al. 2025, ArXiv e-prints [arXiv:2509.10455] [Google Scholar]
- Silk, J., & Rees, M. J. 1998, A&A, 331, L1 [NASA ADS] [Google Scholar]
- Spinelli, C., Veronica, A., Pacaud, F., et al. 2025, A&A, 700, A220 [NASA ADS] [CrossRef] [EDP Sciences] [Google Scholar]
- Sun, M. 2012, New J. Phys., 14, 045004 [NASA ADS] [CrossRef] [Google Scholar]
- Sun, M., Voit, G. M., Donahue, M., et al. 2009, ApJ, 693, 1142 [NASA ADS] [CrossRef] [Google Scholar]
- Tempel, E., Tuvikene, T., Kipper, R., & Libeskind, N. I. 2017, A&A, 602, A100 [NASA ADS] [CrossRef] [EDP Sciences] [Google Scholar]
- Umetsu, K., Sereno, M., Lieu, M., et al. 2020, ApJ, 890, 148 [NASA ADS] [CrossRef] [Google Scholar]
- Zhang, Y., Comparat, J., Ponti, G., et al. 2024, A&A, 690, A268 [NASA ADS] [CrossRef] [EDP Sciences] [Google Scholar]
- Zou, S., Maughan, B. J., Giles, P. A., et al. 2016, MNRAS, 463, 820 [Google Scholar]
Appendix A: Data reduction
We collected the XMM-Newton data for the 49 X-GAP groups and uniformly analysed them using the XMMSAS package v19.1 and the X-COP analysis pipeline (Rossetti et al. 2024). The data analysis procedure closely follows the procedure outlined in Eckert et al. (2025). After performing the standard event screening procedures, we extracted photon maps from the European Photon Imaging Camera (EPIC) data in the [0.7-1.2] keV band, which maximises the signal-to-background ratio. We then computed exposure maps and non X-ray background maps following the procedure outlined in Rossetti et al. (2024). Finally, we extracted spectra in concentric annuli centred on the X-ray emission peak and fitted the resulting spectra in XSPEC with the Atomic Plasma Emission Code (APEC) v3.0.9. The XMM-Newton non X-ray background was modelled as a combination of the quiescent particle background from filter-wheel-closed data, and residual soft protons, predicted from the difference in measured high-energy count rate between the regions located inside and outside the field of view. The local X-ray background was modelled as a combination of two APEC components describing the local hot bubble and the Galactic halo, and a hard power law to describe the cosmic X-ray background. The intensity of these components was jointly fitted to the spectra of the outermost region of the XMM-Newton field of view and to the ROSAT all-sky survey spectra extracted in a circular annulus located 1 and 1.5 degrees from the group centre. All the background components were then properly rescaled to the area of each annular region to determine the remaining source spectrum. For details on the data analysis procedure we refer the reader to Eckert et al. (2025).
Appendix B: Integrated quantities of X-GAP groups
In most cases (41/44), the observations were deep enough to enable an analysis of the radial temperature profile of the source. In the remaining three cases, the XMM-Newton observations were strongly affected by soft proton flares, with a clean exposure time smaller than 2 ks.
Whenever a temperature profile is available, we fitted a Navarro-Frenk-White (NFW) model to the temperature and surface brightness profiles under the assumption of HSE, using the public packages pyproffit (Eckert et al. 2020) and hydromass Eckert et al. (2022). We then estimated the overdensity radius R500 from the NFW fit. We integrated the surface brightness profile out to the derived R500 radius to determine the total cylindrical X-ray luminosity in the rest-frame [0.5 − 2] keV band. We also integrated the model temperature profile out to R500 to estimate the mean spectroscopic temperature T500. We note that the best fitting NFW masses agree well with the masses estimated from mass-temperature (Umetsu et al. 2020) and mass-velocity dispersion relations (Munari et al. 2013), with typical differences of ∼10%.
For the three systems with highly flared observations, HSE masses could not be directly calculated. In another five cases, the morphology was found to be highly disturbed, such that the assumptions of HSE and spherical symmetry do not hold. In these cases, we extracted a single global temperature within a circular aperture of 300 kpc radius, and used the mass-temperature relation of Umetsu et al. (2020) to estimate R500. We then integrated the luminosity and the temperature within the corresponding apertures. The temperatures, luminosities, and HSE masses for the 44 groups that strictly match the X-GAP selection criteria are provided in Table D.1. For the observations that were strongly affected by soft proton flares, the masses are estimated from the M500 − T300kpc relation of Umetsu et al. (2020). The same applies to the merging systems, where the assumption of a single halo in hydrostatic equilibrium does not hold.
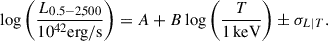
Appendix C: Comparison with literature measurements
To check how the X-GAP LX − T relation compares with previous estimates, we retrieved LX − T estimates from the literature and plotted them against our measurements. Specifically, we considered the LX − T relations at R500 for ROSAT-selected groups, both for the brightest systems in the ROSAT all-sky survey (Lovisari et al. 2015) and the 400d area (Zou et al. 2016). We also considered the Sun (2012) relation, which was extracted from a set of 43 groups in the Chandra archive. The Lovisari et al. (2015) relation in the [0.1-2.4] keV band was converted to the [0.5-2] keV band assuming a single-temperature APEC model and a metallicity of 0.3 Z⊙. We also compared with the LX − T relation of groups selected in the XMM-XXL survey (Giles et al. 2016). In the latter case, the temperatures are estimated within a fixed aperture of 300 kpc radius. The comparison with these relations can be found in Fig. C.1. We also fitted the LX − T relation of the X-GAP sample, without considering selection effects (see Sect. 3.2). To this aim, we modeled the relation as a power law with log-normal intrinsic scatter,
 (C.1)
(C.1)
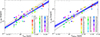 |
Fig. C.1. LX − T relation as a function of T500 (left) and T300kpc (right) for X-GAP (coloured symbols, see Table D.1) in comparison with literature measurements. In the left-hand panel, the magenta and green curves show the bias-corrected relations from Lovisari et al. (2015) and Zou et al. (2016), respectively. The orange curve in the right-hand panel is the LX, 500 − T300kpc relation from XMM-XXL (Giles et al. 2016). In both panels, the blue curve shows the fit to the X-GAP LX − T relation, with the uncertainty in the mean indicated as the dark blue shaded area and the scatter around the mean indicated in light blue. |
We used PyMC2 to fit the relation to the data, including the uncertainties on both axes. The best fitting parameters for the L0.5 − 2, 500 − T500 and L0.5 − 2, 500 − T300kpc relations are provided in Table C.1 and shown in blue in Fig. C.1.
Results of power-law fits to the LX − T relation with Eq. C.1.
We can see that the X-GAP LX − T relation lies close to previous relations obtained from X-ray selected groups. Our relation agrees well with the Lovisari et al. (2015) and Zou et al. (2016) relations around 1 keV, but the slope retrieved here is slightly shallower. Conversely, the LX − T relation from Sun (2012) has a higher normalisation, likely because of a biased group selection based on the Chandra archive. The relatively flat slope is due to the most massive systems in the sample (2 − 3 keV), which appear under-luminous with respect to all the relations considered here. The flatter slope retrieved here can be largely explained by selection effects, as the most massive systems in the sample are expected to include primarily down-scattered systems, since the upper luminosity cut (Eq. 1) excludes brighter systems of similar mass from the sample. Our simulations (Sect. 3.2) show that this is the primary reason for the lower X-ray luminosity of the selected systems at the high-temperature end. Conversely, the X-GAP LX − T relation appears close to the XMM-XXL relation (Giles et al. 2016) at the high-mass end and slightly above around 1 keV. The intrinsic scatter of the relation (0.2 dex) is similar to the value retrieved by Giles et al. (2016) in XMM-XXL but nearly twice as high as the values estimated from the brightest ROSAT groups (Lovisari et al. 2015). While we differ a full analysis of the X-GAP scaling relations including the selection function to a further paper, we note that all the relations lie within 0.15 dex of the X-GAP relation at all temperatures, which reinforces the tension with the predictions of the FLAMINGO fgas−8σ run.
Appendix D: Data table
Luminosities and temperatures of X-GAP groups considered in this study.
All Tables
All Figures
|
Fig. 1. Luminosity–mass (left) and luminosity–temperature (right) relations for X-GAP groups (colored symbols, see Table D.1). The solid curves show the relations obtained in various FLAMINGO runs (see B24). In the left-hand panel, the black diamonds show the luminosity–mass relation of optically selected groups in the eFEDS field (Popesso et al. 2025). |
| In the text | |
|
Fig. 2. Predicted median temperatures (left) and number of selected groups (right) for FLAMINGO runs with varying feedback. Each data point shows the median and 16th and 84th percentiles of simulated X-GAP-like mock samples. The orange vertical lines show the median temperature and the number of selected groups in the observed X-GAP sample. The numbers on top indicate the statistical significance of the difference with the data. |
| In the text | |
|
Fig. C.1. LX − T relation as a function of T500 (left) and T300kpc (right) for X-GAP (coloured symbols, see Table D.1) in comparison with literature measurements. In the left-hand panel, the magenta and green curves show the bias-corrected relations from Lovisari et al. (2015) and Zou et al. (2016), respectively. The orange curve in the right-hand panel is the LX, 500 − T300kpc relation from XMM-XXL (Giles et al. 2016). In both panels, the blue curve shows the fit to the X-GAP LX − T relation, with the uncertainty in the mean indicated as the dark blue shaded area and the scatter around the mean indicated in light blue. |
| In the text | |
Current usage metrics show cumulative count of Article Views (full-text article views including HTML views, PDF and ePub downloads, according to the available data) and Abstracts Views on Vision4Press platform.
Data correspond to usage on the plateform after 2015. The current usage metrics is available 48-96 hours after online publication and is updated daily on week days.
Initial download of the metrics may take a while.