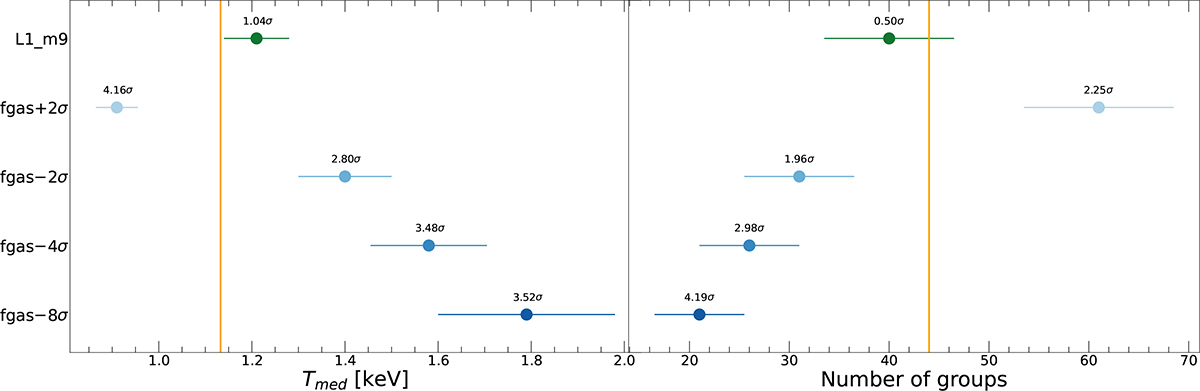
Fig. 2.
Download original image
Predicted median temperatures (left) and number of selected groups (right) for FLAMINGO runs with varying feedback. Each data point shows the median and 16th and 84th percentiles of simulated X-GAP-like mock samples. The orange vertical lines show the median temperature and the number of selected groups in the observed X-GAP sample. The numbers on top indicate the statistical significance of the difference with the data.
Current usage metrics show cumulative count of Article Views (full-text article views including HTML views, PDF and ePub downloads, according to the available data) and Abstracts Views on Vision4Press platform.
Data correspond to usage on the plateform after 2015. The current usage metrics is available 48-96 hours after online publication and is updated daily on week days.
Initial download of the metrics may take a while.