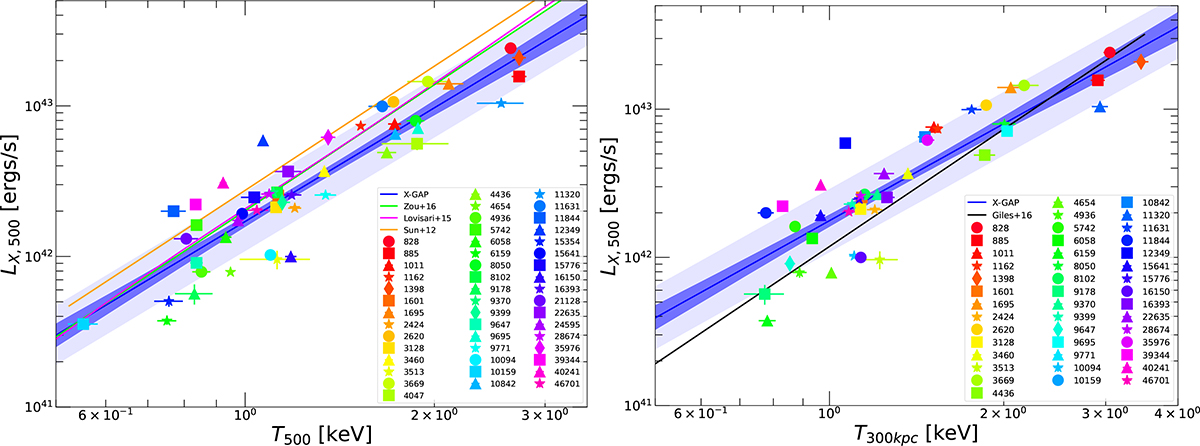
Fig. C.1.
Download original image
LX − T relation as a function of T500 (left) and T300kpc (right) for X-GAP (coloured symbols, see Table D.1) in comparison with literature measurements. In the left-hand panel, the magenta and green curves show the bias-corrected relations from Lovisari et al. (2015) and Zou et al. (2016), respectively. The orange curve in the right-hand panel is the LX, 500 − T300kpc relation from XMM-XXL (Giles et al. 2016). In both panels, the blue curve shows the fit to the X-GAP LX − T relation, with the uncertainty in the mean indicated as the dark blue shaded area and the scatter around the mean indicated in light blue.
Current usage metrics show cumulative count of Article Views (full-text article views including HTML views, PDF and ePub downloads, according to the available data) and Abstracts Views on Vision4Press platform.
Data correspond to usage on the plateform after 2015. The current usage metrics is available 48-96 hours after online publication and is updated daily on week days.
Initial download of the metrics may take a while.