


| Issue |
A&A
Volume 709, May 2026
|
|
|---|---|---|
| Article Number | A263 | |
| Number of page(s) | 18 | |
| Section | Extragalactic astronomy | |
| DOI | https://doi.org/10.1051/0004-6361/202558184 | |
| Published online | 27 May 2026 | |
The kinematic imprinting of environmental quenching in z < 0.2 galaxies
1
European Southern Observatory, Karl-Schwarzschild-straße-2, 85748 Garching bei München, Germany
2
Excellence Cluster ORIGINS, Boltzmann-straße-2, 85748 Garching bei München, Germany
3
School of Physics and Astronomy, University of Nottingham, University Park, Nottingham NG7 2RD, UK
4
Institute of Physics, Ecole Polytechnique Fédérale de Lausanne (EPFL), Observatoire de Sauverny, 1290 Versoix, Switzerland
5
INAF – Padua Astronomical Observatory, Vicolo Osservatorio 5, I-35122 Padova, Italy
6
INAF – Astronomical Observatory of Trieste, Via Tiepolo 11, I-34143 Trieste, Italy
7
INAF – Arcetri Astrophysical Observatory, Largo E. Fermi 5, I-50125 Florence, Italy
8
International Centre for Radio Astronomy Research (ICRAR), University of Western Australia, Crawley, WA 6009, Australia
9
ARC Centre of Excellence for All Sky Astrophysics in 3 Dimensions (ASTRO 3D), Sydney, NSW 2000, Australia
10
Faculty of Physics, Ludwig-Maximilians University, Scheiner-straße-1, 81679 Munich, Germany
11
Max Planck Institute for Astrophysics, Karl-Schwarzschild-straße-1 Garching bei München, 85748, Germany
★ Corresponding author: This email address is being protected from spambots. You need JavaScript enabled to view it.
Received:
19
November
2025
Accepted:
3
March
2026
Abstract
We present the first systematic census of quenching mechanisms using kinematic asymmetries in a large sample of ∼6700 galaxies from the MaNGA survey, thus providing a unified view of what halts star formation in the local Universe (z ≲ 0.2). We quantify stellar and nebular gas disturbances through the higher-order terms of a Fourier series expansion, as implemented in the KINEMETRY package. These asymmetries serve as powerful diagnostics as different quenching mechanisms leave distinct kinematic signatures on gas and stars. Our analysis reveals that the most effective quenching pathways leave minimal kinematic imprints by the time galaxies are fully quenched. This kinematic regularity points toward slow-acting processes (≳3 Gyr) such as starvation and maintenance feedback. A striking finding emerges from our mass-matched analysis: quenched symmetric satellites are significantly more compact than their asymmetric counterparts (3.4σ), a trend that is even more pronounced for symmetric centrals (12.3σ). Our results suggest that environment drives the dominant satellite quenching pathway through rapid gas stripping followed by long-term starvation. These compact, kinematically undisturbed satellites (the most representative case within our sample) have undergone intense gas stripping and central compaction, creating bulge-like structures with old metal-rich stellar populations. Combined with halo gas cutoff and the prevention of cosmological accretion due to starvation, this creates an irreversible quenching path. Conversely, the larger sizes of disturbed quenched centrals are consistent with merger-driven growth, where dry and minor mergers account for approximately 30% of local massive quenched centrals. Internal processes, likely driven by the AGN cycle over 1–3 Gyr that prevents hot halo gas cooling, sustain quenching maintenance in this population. The absence of asymmetric satellites in the star-forming regime suggests that environmental quenching operates without significant kinematic perturbation.
Key words: galaxies: evolution / galaxies: groups: general / galaxies: interactions / galaxies: kinematics and dynamics / galaxies: structure
© The Authors 2026
 Open Access article, published by EDP Sciences, under the terms of the Creative Commons Attribution License (https://creativecommons.org/licenses/by/4.0), which permits unrestricted use, distribution, and reproduction in any medium, provided the original work is properly cited.
This article is published in open access under the Subscribe to Open model. This email address is being protected from spambots. You need JavaScript enabled to view it. to support open access publication.
1. Introduction
Satellite galaxies make up ∼30–40% of the local galaxy population at z < 0.1; most of them are found in groups (Eke et al. 2004; Yang et al. 2007; Tempel et al. 2015; Tinker 2021; Yang et al. 2021). While both centrals and satellites are shaped by their connection to the host dark matter halo, the nature of that connection differs. Central galaxies are mainly regulated by internal mechanisms, particularly feedback between the supermassive black hole and the surrounding circumgalactic medium (CGM). Satellite evolution, by contrast, is more complex as it depends on the halo merger history, the thermodynamic and dynamical state of the host halo, and interactions with other galaxies. A satellite may begin as the central of a lower-mass halo before accretion or may remain a satellite throughout, navigating diverse merger histories and environments. These environments primarily quench satellites through gas-removal processes, though AGN feedback–CGM interactions may also contribute.
In the starvation scenario, first proposed by Larson et al. (1980), the hot gas reservoir of a satellite is stripped, cutting off the supply of cooling gas needed to replenish the disk and sustain star formation. Simulations show that this can occur as satellites lose their CGM upon infall into a massive host halo (e.g., Trussler et al. 2020). This process differs fundamentally from rapid gas-removal mechanisms or internal feedback processes, and operates on significantly longer timescales (> 3 Gyr). Cold gas can also be removed through stripping and tidal mechanisms. One of the most effective is ram pressure stripping, caused by the interaction between a galaxy and the hot ambient medium in massive halos (Gunn & Gott 1972; Vulcani et al. 2018b, 2021). This process removes the outer H I disk along the orbit, and its efficiency depends on the density of the surrounding gas and on the galaxy’s velocity, which makes it particularly strong in clusters. Its most striking observational signatures are jellyfish galaxies, which show disturbed morphologies and gaseous tails aligned with their orbital motion (Poggianti et al. 2017, 2019; Vulcani et al. 2018a). Alternatively, cold gas may be lost through tidal stripping, during close gravitational encounters with other satellites or the central galaxy (Kang & van den Bosch 2008; Pasquali et al. 2010; Vulcani et al. 2021). In dense environments, repeated high-speed encounters can enhance this process, a mechanism known as harassment (Moore et al. 1998).
The combined effect of several–or all–of the aforementioned processes contributes to the higher fraction of passive satellite galaxies observed in massive halos, compared to centrals of similar stellar mass residing in lower-mass halos. In the local Universe, satellites are more likely to fall below the main sequence (MS) of star-forming galaxies, where they make up the bulk of the quenched population at stellar masses below 1010.8 − 11 M⊙ Popesso et al. (2019). This phenomenon, commonly referred to as satellite quenching, plays a central role in shaping the evolution of more than half of the quenched galaxy population observed today (see Cortese et al. 2021, for a full review).
Disentangling the relative contributions of different satellite quenching mechanisms remains a complex challenge. Each mechanism is expected to leave distinct kinematic signatures on the gaseous and stellar components of galaxies (e.g., Bloom et al. 2018; Bagge et al. 2023). For example, starvation is thought to leave the stellar morphology largely intact, gradually quenching star formation as the cold gas reservoir is consumed. In such cases, one would expect a reduced cold gas (HI) fraction, while the galaxy morphology remains unchanged. In contrast, tidal processes are expected to disturb both the gas and the stellar kinematics. Ram pressure stripping alters gas and stellar motions along the satellite’s orbital path, often producing clear kinematic asymmetries (see Poggianti et al. 2025). Meanwhile, tidal disruptions and harassment can affect the distribution of gas and stars without a preferred direction, resulting in irregular disk structures or, after multiple high-speed encounters, leaving only a central bulge as the remnant (see Moore et al. 1998). Although all these processes appear to directly affect the kinematics of galaxies by the time they are fully quenched, we also note that previous studies have shown that quenching and kinematic–morphological transformation are not necessarily closely connected (e.g., Emsellem et al. 2011; Krajnović et al. 2011; Wang et al. 2020, 2024).
Identifying the physical drivers of satellite quenching requires a joint analysis of gas and stellar kinematics, typically through IFU spectroscopy, together with cold gas content and host halo properties. Previous studies have used azimuthally averaged profiles of star formation rate (SFR), specific SFR (sSFR), metallicity, and stellar age to reveal gradients tied to galaxy evolution (e.g., Bluck et al. 2020), but such methods cannot establish direct causal links. Kinematic asymmetries, by contrast, provide a more direct diagnostic, preserving spatial and dynamical information that reflects the underlying environmental interactions. To date, detailed kinematic analyses have focused mainly on cluster environments, most notably the 76 cluster satellites observed with MUSE in the GASP survey (Poggianti et al. 2017, 2025). However, clusters contain only 2–3% of local galaxies, while most satellites reside in groups (Yang et al. 2005; Tempel et al. 2015; Yang et al. 2021).
The Mapping Nearby Galaxies at Apache Point Observatory (MaNGA) survey (Bundy et al. 2015; Abdurro’uf et al. 2022), which observed ∼10 000 galaxies up to z ∼ 0.15, samples the group regime thanks to its volume-limited design. Its spatial and spectral resolution enables velocity maps from both stellar absorption and gaseous emission features, thus allowing robust measurements of kinematic asymmetries with tools such as KINEMETRY (e.g., Krajnović et al. 2006). These asymmetries are quantified as deviations in velocity profiles along elliptical annuli, traced by higher-order Fourier coefficients (e.g., Krajnović et al. 2006; Di Teodoro & Fraternali 2015; Bloom et al. 2017; Di Teodoro & Peek 2021; Bagge et al. 2024; de Isídio et al. 2024). By combining MaNGA IFU data with SDSS-based group catalogs (e.g., Yang et al. 2005; Tempel et al. 2015; Tinker 2021), we directly connect kinematic signatures with environmental processes. Our goal is to disentangle the roles of starvation, gas stripping, and tidal interactions in quenching satellite galaxies by analyzing their distinct imprints on gas and stellar velocity fields, together with cold gas content trends across stellar mass and halo environment. Compared to previous IFU-based studies such as GASP, this work increases the sample size by a factor of ∼40 and extends the explored halo mass range by over three orders of magnitude, from galaxy pairs to massive clusters.
This paper is organized as follows. In Sect. 2 we describe our observational and simulated galaxy samples and the criteria used for their selection. Section 3 outlines the methodology used to identify and quantify kinematic asymmetries. In Sect. 4 we present the main results, focusing on the roles of starvation and gas stripping in shaping galaxy evolution, and we compare them with the results from the simulated dataset. Finally, in Sect. 5 we summarize our findings and conclusions.
Throughout this paper, we adopt a flat ΛCDM cosmology with H0 = 68.7 ± 3.1 km s−1 Mpc−1, Ωm = 0.3, ΩΛ = 0.7, and a baryon fraction of fb = Ωb/Ωm = 0.187 (Aghanim et al. 2020).
2. Data and sample selection
We describe below the MaNGA survey, our selection criteria and general properties of the sample.
2.1. The MaNGA survey
The MaNGA survey is part of the fourth-generation Sloan Digital Sky Survey (SDSS-IV; Blanton et al. 2017) and is comprised of 10 010 unique galaxies (Bundy et al. 2015; Abdurro’uf et al. 2022). MaNGA provides spatially resolved spectroscopic data observed with the two identical BOSS spectrographs mounted on the 2.5 m telescope at Apache Point Observatory (Gunn et al. 2006; Smee et al. 2013; Drory et al. 2015). All MaNGA galaxies are in the nearby Universe at z ≤ 0.15. The data covers a spectral range from 3600 to 10 000 Å, convenient for studying line emissions of ionized gas, such as [OIII] and Hα, with a resolving power of R ∼ 2000 at a spatial resolution of ∼1.5 kpc. The survey is designed to map all galaxies out to at least 1.5 Reff1.
2.2. SDSS-related catalogs
2.2.1. General properties.
The general properties of the sample, such as stellar mass, SFR, and effective radius of MaNGA galaxies are taken from Sánchez et al. (2022), based on the pyPipe3D pipeline. pyPipe3D processes the IFS data cubes to extract spatially resolved spectroscopic properties of both the stellar population and the ionized gas emission lines. The stellar metallicities are taken from the SDSS-based catalog of Gallazzi et al. (2005), after cross-matching with the MaNGA catalog.
2.2.2. Galaxy environment.
Environmental information for MaNGA galaxies comes from an updated version of the Yang et al. (2007) catalog (hereafter Y07), which applies the halo-based group finder of Yang et al. (2005) to SDSS. The catalog contains ∼470 000 groups, from clusters to isolated galaxies, and provides central/satellite classifications along with two halo mass proxies: one based on total stellar mass and the other on total R-band luminosity. The group-finder’s performance has been validated with simulations, showing accuracies of ∼80% for group membership and ∼95% for central identification (Marini et al. 2025). In our sample, only 40% of centrals have direct halo mass measurements from Y07; the rest are either isolated or fainter than MR = −19.5. For these galaxies, halo masses are inferred from the stellar mass–halo mass relation of Behroozi et al. (2010, 2013). In Fig. 1 we display the SFR-M★ plane color-coded by the fraction of satellites. The halo mass distribution for the measured subset is shown in the middle panel of Fig. 2. Throughout this paper, we define centrals to be the most massive galaxy within a given dark matter halo and satellites to be any other group or cluster member. We note that an isolated galaxy is taken to be the central of its group of one.
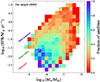 |
Fig. 1. Distribution of our sample of galaxies in the SFR-M★ plane, color-coded by the fraction of satellites. As expected, the highest satellite fractions are found among quiescent galaxies with M★ ≲ 1010.5 M⊙, a region we refer to as the satellite region. The lines indicate the boundaries separating star-forming, green valley, and quiescent galaxies, as presented in Behroozi et al. (2019). |
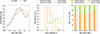 |
Fig. 2. Left panel: Stellar mass distribution of our MaNGA sample including both central and satellite galaxies. Middle panel: Halo mass distribution of our sample separated by centrals or satellites. Right panel: Fraction of centrals and satellites per stellar mass bin. In all panels, we show the representativeness of our sample by comparing it to SDSS spectroscopic sample complete in stellar mass down to 1010 M⊙ at z ∼ 0.085. |
2.2.3. Morphology.
The morphological classification is provided by the MaNGA Deep Learning Morphological Value Added Catalogue (MDLM-VAC-DR17; Domínguez Sánchez et al. 2022). MDLM-VAC-DR17 offers deep-learning-based morphological classifications using convolutional neural networks. The classification includes Hubble T-type numerical morphologies, with a refined separation between ellipticals and S0s, and the identification of edge-on and barred galaxies. The T-type morphologies ranges from –4 to ∼9, where the transition between early and late types happens around T-type∼0.
2.2.4. Gas fraction.
H I gas masses and fractions for a subsample of MaNGA galaxies are publicly available in the HI-MaNGA catalog2 (Masters et al. 2019; Stark et al. 2021), an ongoing H I follow-up program to SDSS-IV MaNGA. The catalog combines Green Bank Telescope (GBT) observations with previously published data. The latest release (DR3.1) includes new GBT measurements for 3477 MaNGA galaxies and 3274 additional systems observed in the Arecibo Legacy Fast ALFA survey (ALFALFA; Giovanelli et al. 2005). H I masses are computed following the method described in Stark et al. (2021).
2.3. MaNGA gas and stellar velocity maps
The MaNGA Data Analysis Pipeline (DAP) fits all emission lines with a tied velocity, providing a single velocity measurement per spaxel (Westfall et al. 2019). Gas kinematics are primarily derived from the Hα line (λ6564 Å), which is the strongest and most reliable tracer in both star-forming and low-ionization regions (Belfiore et al. 2019). Although the DAP outputs kinematic maps for all emission lines, we use Hα exclusively to maintain consistency and physical interpretability, following the validation of its robustness even at low S/N.
Stellar kinematic maps are obtained from absorption features (e.g., FeI λ4383 Å, Hβλ4861 Å) using the penalized pixel-fitting method PPXF (Cappellari & Emsellem 2004) as implemented in the DAP. Templates from the MILES-HC library (Sánchez-Blázquez et al. 2006; Falcón-Barroso et al. 2011) are fit to Voronoi-binned spectra (S/N > 10), with additive polynomials correcting continuum mismatches. Since the gas kinematics may differ (e.g., due to asymmetric drift or outflows), we adopt Hα as our primary gas tracer because of its high S/N and clear mapping of ionized gas dynamics. In the MaNGA DAP, emission lines are fit using a hybrid binning scheme in which the gas kinematics are extracted from spaxel-level fits, with Balmer and forbidden lines tied kinematically to a common velocity and velocity dispersion. This approach preserves spatial resolution for the ionized gas while ensuring stable kinematic measurements, allowing us to identify non-axisymmetric structures such as bars and spiral arms.
Since MaNGA survey does not provide direct S/N maps of the emission lines, we calculate the S/N per spaxel, here defined as flux divided by the flux error, following the MaNGA Data Analysis Pipeline tutorial3 (see Appendix A).
2.4. Sample selection
Since the analysis of the galaxy kinematics requires an accurate measure of the resolved velocity maps, we apply the following selection criteria to ensure high data quality:
-
All spaxels of the stellar continuum and the emission line maps used in the analysis must have S/N > 5 to be considered valid;
-
Galaxies must have at least 90% of valid spaxels within 1 Reff;
-
All galaxies must have environment measures in either Y07 or Argudo-Fernández et al. (2015);
-
Errors in the velocity must be lower than 40% of the velocity value itself. This ensures that only spaxels with reliable velocity values are considered.
The selection criteria outlined above yield a final sample of 6680 galaxies. This represents approximately 80% of the original 8471 galaxies with available stellar velocity and velocity dispersion maps derived from the continuum. About ∼70% of our final sample have valid gas kinematics from emission lines following our selection criteria outlined above, while ∼80% of them have valid stellar kinematics. To check how representative the selected sample is of the underlying local galaxy population, Fig. 2 shows the stellar mass, halo mass and satellite and central fractions for the final sample compared to the SDSS spectroscopic sample complete in stellar mass down to 1010 M⊙ at z < 0.085. Our final sample is representative of the bulk of the galaxy population above 1010 M⊙ and provides a fair representation of the local galaxy population in terms of halo mass distribution. Figure 3 shows the distribution of these samples in the SFR–M★ plane. The top panel displays all galaxies with reliable stellar kinematics, color-coded by the S/N of the stellar continuum. It illustrates that both high- and low-mass galaxies across the star-forming MS, green valley, and quiescent region maintain a consistently high S/N (≳15). The bottom panel of Fig. 3 presents the distribution of galaxies with reliable gas velocity and dispersion maps, also in the SFR–M★ plane, color-coded by the average S/N of the Hα line. This distribution diverges from the stellar sample, as galaxies with weak or no emission–especially those below the MS–do not satisfy the selection thresholds for gas kinematics. The overlapping subsample of 3162 galaxies, with both stellar and gas kinematic maps simultaneously, primarily occupies the MS and green valley regions. It is sparsely populated in the starburst region, where strong emission lines are present but the S/N of the stellar continuum is typically too low, and in the quiescent region, where gas emission is often negligible. Satellite galaxies comprise approximately 30% of each sample and subsample, representing a ten- to twenty-fold increase in satellite statistics compared to the GASP survey. The 30% of the population corresponds to satellite galaxies in a precise region at stellar masses lower than ∼1010.5 M⊙ and below the MS consistent with the trend identified in the overall local SDSS galaxy population in Popesso et al. (2019). The sizes of all samples and subsamples are summarized in Table 1.
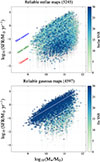 |
Fig. 3. SFR–M★ plane of our galaxy sample, color-coded by the S/N of each individual object. The top panel shows our subsample with reliable stellar velocity maps (i.e., maps with ≥90% valid spaxels within 1Reff). The bottom panel shows galaxies with reliable gaseous velocity maps. The lines indicate the boundaries separating star-forming, green valley, and quiescent galaxies, as defined in Behroozi et al. (2019). |
Modeling results with KINEMETRY.
Results for symmetric and asymmetric satellites and centrals.
3. Tracing kinematic asymmetries
3.1. The KINEMETRY package
To identify kinematically asymmetric galaxies, we use the KINEMETRY package4, developed by Krajnović et al. (2006). This code analyzes 2D maps of the moments of the line-of-sight velocity distribution (intensity, velocity, velocity dispersion) by performing harmonic expansions along best-fitting ellipses, providing a robust quantification of kinematic structures and subcomponents (Krajnović et al. 2006). It models velocity profiles as a Fourier series,
 (1)
(1)
where ψ is the eccentric anomaly, a the semi-major axis length, and A0 the systemic velocity. Outputs include the position angle, ellipticity, and asymmetry coefficients. The final ellipse parameters obtained by minimization are then used to describe an elliptical ring from which a kinematic profile is extracted and expanded on to the harmonic series of Eq. (1), where the coefficients (An, Bn) are determined by a least-squares fit with a basis {1, cos(ψ), sin(ψ),…,cos(Nψ), sin(Nψ)} Krajnović et al. (2006). KINEMETRY has been widely validated as a tracer of kinematic asymmetries, successfully identifying features linked to mergers, gas stripping, bars, and feedback-driven turbulence (e.g., Shapiro et al. 2008; Liu et al. 2013; Holmes et al. 2015; Bloom et al. 2018; Simons et al. 2019; Slater et al. 2019; Feng et al. 2022). We quantify asymmetries using the parameter
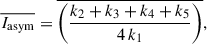 (2)
(2)
where k1 is the amplitude of the rotating component and higher-order terms (k2–k5) represent nonrotating contributions (Krajnović et al. 2006; Shapiro et al. 2008). While some studies consider only odd modes (e.g., k3 and k5; Bloom et al. 2017, 2018), we include all terms to also capture signatures of major mergers. Equal contributions from rotating and nonrotating components yield Iasym ≥ 0.25 (log Iasym ≥ −0.60). Bloom et al. (2017) adopted a threshold of Iasym ≥ 0.065 (−1.19 in log), while Feng et al. (2022) used Iasym ≥ 0.039 (−1.41 in log). Here, we adopt an intermediate threshold of Iasym ≥ 0.05 (−1.30 in log), corresponding to a ∼18% nonrotating contribution.
We apply KINEMETRY to both stellar and gaseous velocity maps in our MaNGA sample. Examples of galaxies with different asymmetry levels are shown in Fig. A.1, with the last three rows illustrating asymmetric stellar kinematics. Table 1 reports the number of asymmetric galaxies identified in stars and gas, including the fraction of asymmetric satellites relative to the valid sample (see Sect. 2.4).
3.2. Identification of ram pressure stripped galaxies in MaNGA
Jellyfish galaxies have been widely studied as probes of gas-stripping processes and their kinematic impact on galaxy evolution (e.g., Poggianti et al. 2017; Jaffé et al. 2018; Vulcani et al. 2018a). These systems are characterized by extended gaseous tails stripped from the galaxy body. Because MaNGA’s FoV is relatively small, it will not capture the full extent of these features. To test whether KINEMETRY can still identify such systems in MaNGA, we evaluated its performance using gas velocity maps from the GASP survey, which provides wide-field MUSE observations ideally suited for studying stripping.
Unlike GASP, which reaches several Reff, MaNGA typically covers only ∼1.5 Reff, while stripping tails often extend much farther (e.g., Poggianti et al. 2025). To assess the impact of this limitation, we randomly selected 23 GASP galaxies5, including 13 with confirmed and strong ram pressure stripping signatures (see Appendix B, notably Table B.1 and Fig. B.2). After visually inspecting the maps, we (i) ran KINEMETRY on the full velocity maps; (ii) cropped them to MaNGA’s average FoV of 24 arcsec (typical range: 12–32 arcsec6); and (iii) re-ran KINEMETRY on the cropped maps. The asymmetry parameters measured within MaNGA’s aperture are consistent with those from the full GASP FoV. For 20/23 galaxies, an aperture of 2× MaNGA’s FoV was sufficient to capture all relevant emission (see Fig. B.1). Using MaNGA’s average FoV and our adopted asymmetry threshold, KINEMETRY correctly identifies as being asymmetric 12/14 (86%) galaxies with confirmed ram pressure stripping signatures. Out of the remaining cases (11 galaxies), 4 galaxies are classified as symmetric using either the MaNGA or the GASP FoV; 2 have been consistently classified as asymmetric with both apertures, as expected given that they are ongoing mergers; and the remaining are also classified as asymmetric, although not due to ram pressure as we show in Table B.1. Thus, up to ∼20% of ram pressure stripped galaxies with extended tails may go undetected due to MaNGA’s spatial coverage, though this drops to ∼7% with a relaxed threshold of 0.039. It is important to note that jellyfish galaxies themselves are rare, representing only ∼5–15% of cluster satellites (Poggianti et al. 2019; Lee et al. 2022; Vulcani et al. 2022). Their frequency rises in massive halos, where high ICM densities and orbital velocities enhance stripping, and declines in groups, which are the focus of this work (e.g., Roberts et al. 2021). Therefore, even if ∼20% of jellyfish are missed, the overall impact on our group satellite sample is negligible.
Due to the requirement of a S/N > 5 in over 90% of the spaxels within Reff, the KINEMETRY analysis could be applied to 6680 galaxies, corresponding to 80% of the initial MaNGA sample. Of these, 5245 galaxies were suitable for analysis of absorption features in the stellar continuum, while 4597 galaxies allowed for the analysis of gas asymmetries through emission lines. The two subsets overlap for 3162 galaxies, for which both stellar and gas components could be analyzed.
4. Results
Galaxies with KINEMETRY results for the stellar velocity maps span the full extent of the SFR–M★ plane (top panel of Fig. 3). Systems with the lowest S/N are predominantly extremely gas-rich galaxies, where the spectra are dominated by emission lines and the stellar continuum is weak. The gas kinematic analysis was primarily feasible for galaxies on the star-forming MS, typically disky and gas-rich, as well as for a portion of green valley systems (bottom panel of Fig. 3). In contrast, the gas kinematic analysis was applicable to only a negligible fraction of quiescent, gas-poor galaxies, where the spectra lack strong emission lines and are dominated by the continuum. Overall, the combined sample with KINEMETRY data spans the full SFR–M★ diagram with high statistics, as shown in Fig. 3. Approximately 70% of the galaxy population exhibits symmetric stellar or gas kinematics, regardless of morphological type. This fraction remains consistent when considering stellar and gas kinematics separately. Only about 5% of the total sample shows disturbed kinematics in both components.
Figure 4 shows the SFR–M★ plane again, this time color-coded by the average asymmetry index computed from Eq. (2), shown separately for the stellar (upper panel) and gaseous (lower panel) components. A key feature in both distributions is that galaxies, especially those located along the MS but also in the green valley, with stellar masses above ∼ 1010 M⊙, exhibit largely undisturbed stellar and gas kinematics. This suggests that these systems are not significantly affected by disruptive processes, including mergers. This conclusion is robust, as the S/N in both components is highest in this mass range, as shown in Fig. 3. Below ∼ 1010 M⊙, the data indicate a trend toward increasingly disturbed kinematics. However, this regime suffers from sample incompleteness: both the MaNGA and SDSS surveys are known to be biased against low-mass galaxies at the redshifts considered. Despite this, the average S/N in both stellar and gas components remains relatively high (around ∼10), supporting the idea that low-mass galaxies in this sample are genuinely more kinematically disturbed than their higher-mass counterparts.
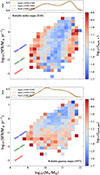 |
Fig. 4. Top panel: Distribution of galaxies with KINEMETRY info on the stellar component in the SFR-M★ plane, color-coded by the average asymmetry parameter of the stellar kinematic map. As in Fig. 3, the lines indicate the boundaries separating star-forming, green valley, and quiescent galaxies as present in Behroozi et al. (2019). The upper curves indicate the PDF of galaxies classified as asymmetric according to different KINEMETRY thresholds in Iasym. Bottom panel: As in the upper panel, but for galaxies with KINEMETRY info on the gaseous component. |
While galaxies on the MS generally exhibit symmetric and undisturbed kinematics in both the stellar and gaseous components, a different trend emerges below the MS, from the green valley toward the quiescent region. In this regime, the most massive galaxies often exhibit clear signs of kinematic disturbance. This is especially evident in the stellar component, which benefits from high S/N in these systems. Similar, though less pronounced, indications are present in the gas kinematics. However, this pattern pertains to only a negligible fraction of the overall sample. The quiescent region is dominated by gas-poor galaxies that lack emission lines and typically have a relatively low S/N (below 10), particularly in the gaseous component, which limits the detectability of the gas kinematic analysis in this population.
4.1. Central versus satellite galaxies
Surprisingly, the fraction of disturbed galaxies remains essentially unchanged when central and satellite galaxies are separated. Table 1 shows that the fraction of symmetric and disturbed galaxies is the same in both the satellite and central galaxy population, ∼30% as in the global population. In principle, one might expect a higher incidence of disturbed kinematics among satellite galaxies, as they are more susceptible to environmental processes that are less effective on central galaxies residing at the bottom of their halo’s potential well. However, this expected difference is not observed in the data.
We emphasize that this result is not due to misclassification of centrals and satellites by the Yang et al. (2005) algorithm. A thorough test of the algorithm, applied to a mock catalog designed to mimic a GAMA-like survey, demonstrated high accuracy–approximately 95%–in identifying central galaxies across halos spanning nearly three orders of magnitude in mass, from Milky Way–like groups to massive clusters (see Marini et al. 2025). Furthermore, the relative fraction of disturbed galaxies remains consistent between centrals and satellites even when applying more relaxed or more stringent thresholds for kinematic disturbance in the KINEMETRY analysis. While the absolute fraction of disturbed systems changes with threshold choice, the trend of similarity across galaxy types holds. This indicates that the observed parity in disturbed kinematics between centrals and satellites is not driven by classification errors or threshold definitions. This conclusion is reinforced by the consistent distribution of disturbed galaxies across stellar mass, shown in the upper subpanel of Fig. 4.
Some differences between centrals and satellites become more apparent when examining the distribution of disturbed galaxies in the sSFR–M★ plane. Figure 5 shows the distribution of symmetric systems (panel a), galaxies with disturbed stellar kinematics (panel b), and galaxies with disturbed gas kinematics (panel c), with centrals and satellites distinguished in each. Galaxies with symmetric stellar or gas kinematics – comprising the majority of the population – follow the global distribution, as confirmed by a Kolmogorov–Smirnov (KS) test. In the diagram, the satellite region is dominated by symmetric systems. In contrast, symmetric centrals are concentrated along the MS and populate the high-mass end of the green valley and quiescent regions.
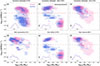 |
Fig. 5. Panel (a): sSFR-M★ plane displaying all symmetric galaxies (Iasym = 0.05) in our sample, including centrals and satellites. Panels (b) and (c): Galaxies with kinematic asymmetries in the stellar component (b) and gaseous component (c). Panel (d): Galaxies with asymmetries in both maps. Panels (e) and (f): Galaxies with asymmetries solely in stars (e) and gas (f). To guide the eye, we show the corresponding PDFs in the lower left corner of each panel. We also show a dashed red line separating quiescent and star-forming galaxies. Following our selection criteria, only galaxies with at least 90% of valid spaxels (spaxels with S/N★,gas > 5) are included. The absence of asymmetric galaxies in the satellite region of the (s)SFR–M★ plane (see also Fig. 1) strongly suggests that the mechanism suppressing star formation in our sample does not significantly impact the kinematic structure of the galaxy. |
When considering only the stellar component, we find that disturbed central galaxies occupy two distinct regions of the sSFR–M★ plane. Among star-forming systems, they lie along the upper envelope of the MS, well above the quiescent threshold defined at sSFR = 10−11 yr−1 (e.g., Wetzel et al. 2012; Behroozi et al. 2019). In contrast, quiescent disturbed centrals are found at the high-mass end, with stellar masses > 1011 M⊙. Satellites with disturbed stellar kinematics, by comparison, are more uniformly distributed across the plane. For both centrals and satellites, the fraction of disturbed galaxies remains similar–ranging from 25% to 30%–above and below the quiescence threshold.
The distribution of disturbed galaxies differs markedly in the gaseous component. For both centrals and satellites, disturbed gas kinematics are predominantly found in galaxies on the MS. This is largely a result of selection effects: galaxies below the quiescence threshold typically lack detectable gas or do not exhibit emission lines with sufficient S/N for reliable analysis. Unlike the stellar component, disturbed gas kinematics in the quiescent region are more uniformly distributed at stellar masses below 1011 M⊙. Notably, among the small subset of galaxies in the quiescent region with detectable Hα emission at sufficient S/N, a significant fraction–44% of centrals and 47% of satellites–exhibit disturbed gas kinematics.
4.2. Identifying environmental processes
To create a causal link between the kinematic signatures in the star and gaseous velocity maps and the possible environmental processes, we define six classes of galaxies depending on their SFR, gas fraction, and asymmetries. We present each of them below.
4.2.1. Case 1: Star-forming galaxies with no sign of asymmetry in the gas and stellar velocity maps
Galaxies in this subsample are considered evolving through secular evolution without environmental effects both in the central and satellite populations. We define the star-forming galaxies as those above the quiescent threshold (sSFR > 10−11 yr−1). Within the star-forming population with valid gaseous and stellar kinematic maps simultaneously (2039), Case 1 galaxies account for the majority (1305; 64%). Symmetric central galaxies dominate this population, accounting for 79.6%, while the remaining are satellites. Central galaxies are distributed along the whole MS, while satellites tend to be mainly at low masses and in the green valley as indicated in Fig. 1.
4.2.2. Case 2: Galaxies with both gas and stellar velocity asymmetry
Such asymmetries might be related to (i) ram pressure stripping, if the asymmetry direction of the velocity maps is along a preferential direction (possibly aligned with the galaxy orbit in the halo), (ii) mergers or tidal interaction coincident with the presence of double source or close pair, (iii) ongoing harassment if the asymmetry has an irregular distribution and there is no clear double source or close pair. Galaxies with disturbed kinematics in both stellar and gaseous components are spread across the full sSFR–M★ plane (Fig. 5d). They represent 5.1% of centrals and 5.5% of satellites, computed relative to the total number of each population, independent of whether both kinematic maps are available. Despite their broad distribution, these galaxies cluster toward the low-mass end of the MS.
For satellites, systems with asymmetric kinematics while still on the star-forming sequence are strong candidates for environmental disturbance via ram pressure stripping or tidal interactions (e.g., Smith et al. 2010; Poggianti et al. 2017). To distinguish between these mechanisms, we identify close companions–defined as galaxies within 200 kpc and a line-of-sight velocity difference of less than 300 km/s. These thresholds are designed to capture recent flybys consistent with the velocity dispersion of group environments, with typical halo masses of 1012.5 M⊙ (Yang et al. 2005). Robustness checks using thresholds relaxed or tightened by ±25 kpc and ±50 km/s yield the error bars reported from now on. We find that 58 % of satellites with disturbed kinematics (gas and stars) have a close companion and are thus likely undergoing tidal interactions, while the remaining ∼40% are candidate ram pressure stripped systems.
Centrals, by contrast, are unlikely to experience ram pressure stripping since they typically reside at the bottom of their halo potential, with minimal relative velocity to the intra-group medium. Applying the same companion search, we find only 31 % of centrals with disturbed kinematics host a close companion, suggesting tidal interactions or minor mergers. Visual inspection further reveals merger signatures–such as double-peaked light distributions–in roughly 40% of these galaxies, supporting minor mergers as an important, though not dominant, mechanism for disturbed kinematics in centrals.
Finally, we test for AGN-driven feedback using the BPT diagnostic diagram (Fig. C.1), with emission-line ratios derived via pyPipe3D (Sect. 2.2). Only 3% of the sample shows clear AGN outflow signatures, indicating that AGN feedback plays a negligible role in producing the observed disturbances.
4.2.3. Case 3: Galaxies with symmetric stellar velocity maps and asymmetric gas velocity maps
Galaxies in this subsample are interpreted as in the initial stage or mild case of (i) ram pressure stripping if without companion, (ii) initial stage of tidal stripping if in a close pair or (iii) with ongoing outflows if the integrated Hα emission shows a double Gaussian component. Galaxies showing asymmetries only in their gaseous kinematic maps represent 13.0% of the full valid sample (6,680), spanning the entire SFR–M★ plane (Fig. 5f). BPT diagnostics indicate that their ionized gas is primarily excited by star formation. Since their stellar kinematics remain symmetric, the gas disturbances likely trace recent events, consistent with the shorter response timescale of gas compared to stars.
Among satellites, this class makes up 12.9% of the subsample. Using the companion selection described above, we find that 51.0 % have a clear companion, while the remaining do not, suggesting that the majority are undergoing (or recently underwent) tidal interactions. For both centrals and satellites, we analyze the contributions from AGN outflows (see Appendix C). Stacked spectra reveal a possible broad Hα component in AGN hosts, but non-AGN satellites show emission lines well fit by a single Gaussian (Fig. C.2), ruling out significant outflows. Thus, gaseous asymmetries are attributed to tidal stripping in systems with companions and to ram pressure stripping otherwise. For star-forming satellites (sSFR > 10−11 yr−1), 53
 % have close companions and are linked to tidal interactions. The remaining ∼47% are strong candidates for jellyfish galaxies undergoing ram pressure stripping, though MaNGA’s FoV limits detection of extended gas tails. For quenched satellites (sSFR < 10−11 yr−1), AGN-driven outflows account for 6.2%, tidal interactions dominate (49.1
 %), and ram pressure has a minor contribution of less than 20%.
Among central galaxies, 13.0% show kinematic disturbances in the gaseous component only. Since ram pressure stripping is ineffective at halo centers, these asymmetries are unlikely to result from this process. We find that 22.4 % have a close companion, indicating that ongoing interactions are not the dominant drivers, but most likely remaining effects of past minor mergers. Only 5.3% of these centrals show clear AGN activity.
4.2.4. Case 4: Gas-rich galaxies with stellar velocity asymmetry
Galaxies in this subsample are interpreted as an indication of minor merger. We define gas-rich galaxies as those with a cold gas fraction7 > 10% and with more than 70% of valid spaxels in the gaseous component. To trace their distribution in the sSFR–M★ plane, we use H I masses from the HI-MaNGA catalog (Sect. 2.2), matching ∼65% of the full sample and ∼71% of satellites. As shown previously (e.g., Brown et al. 2017), the cold gas mass fraction declines with sSFR. Consistently, roughly all gas-rich galaxies in our sample lie above the quiescent threshold and cluster above the MS, extending to M★ ∼ 1011 M⊙. Centrals dominate, comprising 73% of this population.
Within this group, only 27.0 % host a close companion, while 58% show no gas asymmetry despite a high S/N. This suggests that any disruptive event occurred in the past, with gas kinematics relaxing faster than the stellar component (see also Lotz et al. 2008). We interpret these cases (i.e., Case 4 galaxies) as signatures of past minor mergers (no companion) or tidal disruption (close companion).
4.2.5. Case 5: Gas-poor galaxies with stellar velocity asymmetry
Galaxies in this subsample are interpreted as an indication of dry merger. We define gas-poor galaxies as those with a cold gas fraction < 10% and fewer than 70% of valid spaxels within 1Reff in the gaseous component. The H I gas mass fraction is measured as in Case 4. These galaxies all lie below the quiescent threshold, represent 26.4% of the overall sample, and are concentrated at M★ ≳ 1011 M⊙ (Fig. 4). Centrals dominate, accounting for 58% of this group. Our companion search indicates that 31.1 % of the galaxies host a close neighbor. However, only in 6.3
 % of cases is the companion sufficiently close (≤50 kpc) and has a low enough line-of-sight velocity difference (≤250 km/s) to suggest an ongoing merger. For the remaining galaxies with companions (∼25%), the observed disturbances are likely caused by tidal interactions. The kinematic disturbances in galaxies without a detected companion may result from recent interactions or dry mergers within the last 2 Gyr. Together, this suggests that both recent and ongoing interactions–ranging from tidal encounters to minor or major mergers–are the primary drivers of the stellar kinematic disturbances in quenched, gas-poor galaxies as we further discuss in Sect. 5.1.
4.2.6. Case 6: Galaxies with symmetric stellar velocity maps, no ionized gas, and low H I gas mass fraction
Galaxies in this subsample are interpreted as (i) the end product of starvation and/or strangulation if they are satellites and (ii) feedback quenching maintenance if they are centrals. Galaxies with symmetric stellar velocity maps, no ionized gas (< 20% of valid spaxels), and low H I content are the most represented class in the quiescent region, making up 49% of its population. This group includes 58% of quiescent satellites and 35% of all satellites (Fig. 4). We note that the absence of stellar asymmetries is not due to poor data quality, as this region shows the highest continuum S/N (Fig. 3), confirming the robustness of this result.
A comparable fraction (43%) is found among quiescent centrals, implying either that environment has little impact on stellar kinematics or that different quenching mechanisms converge to similar end states. In the latter case, quenching could arise from processes that leave stellar structures largely intact–such as starvation, strangulation, or repeated AGN feedback cycles (e.g., Dekel & Birnboim 2006; Baxter et al. 2025) as we discuss in Sect. 5.1.
We summarize the main properties of all analyzed cases in Table 3.
Summary of the cases discussed in this work.
4.3. Occurrence of different quenching processes
In Fig. 6 we present the relative occurrence of the different quenching features analyzed case-by-case in this work (see Sect. 4.2). The top panel of Fig. 6 shows the subset of galaxies below our quenching threshold (sSFR < 10−11 yr−1), which accounts for 50.5% of our sample. As discussed throughout Sect. 4.2, the majority of the galaxies we analyze here show no signs of kinematic asymmetries (in either gaseous or stellar components). Following our definition of Case 3 in Sect. 4.2, galaxies with symmetric stellar velocity maps, no significant ionized gas content, and low H I gas mass fractions are interpreted as the end products of starvation (for satellites) or feedback-maintenance quenching (for centrals). This is the case for over 50% of the quenched galaxies analyzed in this work (see Fig. 6).
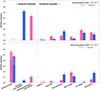 |
Fig. 6. Relative presence of the different quenching mechanisms analyzed in this work. Top panel: All values given relative to the subset of quenched galaxies (sSFR < 10−11 yr−1) with low gas fractions (MHI/M★ < 0.2). Bottom panel: Corresponding mechanisms identified in the star-forming subsample. Galaxies that do not meet the classification criteria are labeled “inconclusive”. The count of galaxies undergoing secular evolution (hatched bars in the bottom panel) is complemented by objects with symmetric gaseous kinematics but insufficient S/N in the stellar maps to classify that component as symmetric. |
Based on our statistically robust sample, the main result of this work suggests that whatever process drove down the star formation in local quenched satellites either did not significantly disturb their kinematic structure or occurred over 3 Gyr ago, leaving sufficient time for kinematics to relax–particularly the stellar component. In the first case, the most plausible explanation is that the quenching of satellites is governed by a starvation-driven scenario, which is expected to be much less disruptive to galaxy kinematics compared to scenarios driven by mergers and/or rapid gas stripping (e.g., Dekel & Birnboim 2006; Peng et al. 2015; Poggianti et al. 2017; Baxter et al. 2025). Alternatively, this local quenched satellite population could represent the end product of repeated tidal interactions and/or intense gas stripping episodes that occurred more than 3 Gyr ago, providing sufficient time for the stellar kinematics to relax and for the system to re-establish a rotation-supported configuration (e.g., Smith et al. 2022). In this context, gas stripping phenomena (e.g., ram pressure, tidal or viscous stripping) may have played an even more significant role compared to starvation, but their dynamical signatures might no longer be observable (e.g., Vollmer et al. 2001). For central galaxies, our results suggest feedback quenching maintenance as a clear mechanism for keeping this population quenched over long timescales (> 3 Gyr). In this proposed scenario, the galaxy is prevented from cooling its hot gaseous halo and re-igniting star formation, thereby maintaining its quenched state previously triggered by either powerful feedback outbursts, major mergers, or rapid gas consumption (e.g., Croton et al. 2006; Fabian 2012).
As expected based on Fig. 5, dry mergers, particularly in central galaxies, contribute a relevant (∼20%) portion to the observed kinematics of local quenched galaxies. When dry mergers and minor mergers are considered together, their overall contribution makes up to 27% of the analyzed cases. Therefore, merging signatures in the observed kinematics of quenched central galaxies represent the second most common case in our sample. In satellites, tidal interactions driven by flybys with relatively close companions (≤200 kpc) seem to contribute more significantly (∼20%) to the overall quenching picture.
Among the star-forming population, passively evolving processes through secular evolution dominate the overall kinematics in both centrals and satellites. This is again consistent with regular kinematics showing no signs of asymmetries. Since these galaxies are star-forming, high S/N (≳30) gaseous maps are also available, meaning that any present asymmetry could be easily detected with KINEMETRY. We also complement the count of galaxies evolving through secular evolution with objects that have symmetric gaseous kinematics but whose stellar maps do not have sufficiently high S/N to be classified as symmetric in that component. This is the case for many star-forming galaxies with high S/N in the Hα component, but very low stellar continuum. For both centrals and satellites, these objects account for ∼13%, as we highlight with hatching in the bottom panel of Fig. 6.
5. Discussion and conclusions
5.1. Linking galaxy quenching, kinematic evolution, and morphological transformation
As we have shown in Case 5, gas-poor galaxies with asymmetric kinematics are likely the result of both past and ongoing interactions. To test this hypothesis, we conducted a mass-matched sampling using 1,000 iterations of balanced subsamples of quenched galaxies above and below the asymmetry threshold (Iasym, ★ = 0.05). We find that asymmetric galaxies in the stellar component have consistently more early-type morphologies. For galaxies with M★ ≥ 109.5 M⊙, the T-type difference between symmetric and asymmetric systems reaches ΔT-type ≈ −1.0, indicating that asymmetric quenched galaxies are preferentially early-type (> 15σ significance) compared to their symmetric counterparts.
We find a striking environmental dependence in the size–asymmetry relation among quenched galaxies. Central galaxies exhibit particularly strong enhancement; asymmetric systems show Reff values that are 32.5% larger than their symmetric counterparts. In the highest-mass bin (M★ ≥ 1011 M⊙),  kpc versus 5.46 ± 0.10 kpc for symmetric centrals (9.9σ significance). Satellites follow a comparable pattern, though less prominent, with the same M★ ∼ 1010.5 M⊙ threshold distinguishing size regimes. Above this mass bin, asymmetric satellites are systematically larger, reaching
  kpc compared to 4.98 ± 0.17 kpc for their symmetric counterparts (3.2σ significance). This size enhancement in centrals supports the merger-driven growth scenario, consistent with models of merger-induced stellar puffing (e.g., Lackner et al. 2012). Stellar mass further modulates this effect. Below M★ = 1010.5 M⊙, symmetric and asymmetric systems have comparable Reff regardless of environment. Above this threshold, the size offset grows with stellar mass, and the most massive asymmetric galaxies are significantly more extended. This trend suggests that size-growth mechanisms–minor mergers or cold gas accretion–are increasingly efficient at high masses, particularly for central galaxies, which dominate the massive end of the population (e.g., Naab et al. 2009).
To further investigate the morphological transformation of quenched symmetric galaxies, we used the same mass-matched approach described above. Morphologies are similar across the two subsamples (all nearly spheroidal, i.e., T-type∼0.0), but centrals consistently show larger sizes. Symmetric centrals have  kpc, whereas symmetric satellites overall display much more compact structures, 2.83 ± 0.05 kpc (16.8σ significance). This offset strongly suggests that centrals and satellites are the products of distinct evolutionary processes as we further discuss in Sect. 5.2.
We summarize these results in Fig. 7, which shows average SFRs and sizes for quenched subsamples in Cases 5 and 6. Two signatures emerge: (1) gas removal truncates star formation (e.g., Peng et al. 2015), and (2) tidal forces strip outer disks, leaving compact bulges (e.g., Lackner et al. 2012). The highly significant SFR offset between symmetric centrals and satellites indicates that environmental processes enhance the quenching (e.g., Poggianti et al. 2017, 2019; Bluck et al. 2020; Baxter et al. 2025; Argudo-Fernández et al. 2015). For satellites, the stripping together with the absence of gas replenishment–due to starvation cutting off hot halo gas and preventing cosmological accretion–locks them onto an irreversible quenching pathway. These compact remnants remain perpetually quiescent, with symmetric stellar kinematics reflecting both disk stripping and the lack of subsequent disturbances.
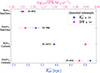 |
Fig. 7. Schematic summary of the SFR- and size-dependent results presented in Cases 5 and 6. Symmetric satellites exhibit the lowest SFRs and the most compact structures among quenched galaxies, suggesting that these objects are the end product of an intense period of mass removal, either via gas striping itself or tidal interactions. |
Our results on the size differences between quenched symmetric and asymmetric centrals (12.3σ) and satellites (3.4σ) strongly suggest that symmetric quenched galaxies in the local Universe have undergone central-compaction-like quenching mechanisms. These processes tend to quench galaxies rapidly and drive the size differences shown in Fig. 7. These findings are broadly consistent with recent simulation-based work by Ni et al. (2025) using ASTRID data, which supports that dissipative processes funnel gas into the central regions, triggering starbursts that lead to rapid quenching and more compact morphologies compared to star-forming galaxies. In contrast, galaxies that quench over longer timescales typically exhibit larger sizes and older central regions, characteristics we identify here in asymmetric galaxies.
As presented above, the observed offset in the overall size distribution of quenched symmetric centrals and satellites strongly suggests that these two populations represent the end product of distinct evolutionary paths. Satellites could result from strong gas stripping or repeated tidal interactions more than 3 Gyr ago, leaving time for the stellar component to relax. Such processes (ram pressure, tidal, or viscous stripping) may erase their dynamical signatures but still reduce satellite mass and size. Centrals, being more massive, are less prone to stripping, and instead deplete gas passively or grow through accretion (e.g., Cortese et al. 2019).
5.2. The quenching pathway
Based on the results we presented in Sect. 4 along with the discussion above, we propose a coherent evolutionary pathway for a typical low- to intermediate-mass quenched satellite: a satellite galaxy falls into a group or cluster halo. It experiences an episode of gas stripping (ram pressure and/or tidal interactions), which removes its H I reservoir and may slightly disturb its kinematics. Repeated episodes of gas stripping and tidal interactions remove the outer stellar disk, truncating the galaxy and increasing its metallicity. The hot halo gas is stripped upon infall (starvation), severing the supply of future cold gas. The satellite consumes its remaining gas and quenches. Over the next few gigayears the kinematic signatures of the initial disturbance dynamically relax, leaving a compact, symmetric, metal-rich, and passive galaxy, which is the most common type of quenched satellite we observed in this work. This pathway explains the kinematic regularity, the low SFR, the high metallicity, and the small size simultaneously, and highlights starvation as the crucial maintenance mechanism that makes quenching irreversible in satellites.
Our results are also consistently aligned with recent work by Leung et al. (2025) on post-starburst galaxies in MaNGA. Their findings support mergers or galaxy-galaxy interactions as the primary mechanism that causes quenching, highlighting that large scale feedback from a starburst or a central AGN play a lesser role. Our findings suggest that for satellite galaxies, a combination of rapid gas stripping followed by long-term starvation can adequately explain the majority of the quenched, yet kinematically undisturbed, satellites observed today. Furthermore, we highlight that our findings are particularly consistent with van den Bosch et al. (2008) and Cortese et al. (2019). Using both observations (SAMI survey) and simulations (EAGLE), Cortese et al. (2019) suggested that satellites undergo little structural change before and during their quenching phase–the main conclusion of this work. Also, at fixed stellar mass, their satellite sample showed higher passive fractions than centrals, suggesting that environment is directly quenching their star formation, as we also find here.
When analyzing the population of star-forming satellites, Fig. 6 shows a negligible contribution from starvation. We emphasize that this trend is expected and provides further support for our main conclusion: starvation is ubiquitous and plays a crucial role in quenching satellites across all stellar masses. By definition, one of the most characteristic effects of starvation is low gas content, which represents the key distinction between the starvation and secular evolution categories presented in Fig. 6. The effects of starvation (e.g., low gas content and unperturbed kinematics), however, become measurable only a few gigayears after the galaxy has fallen into its host halo. Prior to this late stage, such galaxies are correctly classified as evolving through secular evolution, as clearly shown in the bottom panel of Fig. 6.
We also note that previous literature (e.g., Shapiro et al. 2008; Krajnović et al. 2011; Bloom et al. 2017; Feng et al. 2022) has established that kinematic asymmetry is a reliable proxy not only for galaxy-galaxy interactions but also for the V/σ ratio. To verify whether the results presented in Sect. 4.2 are primarily driven by environmental effects rather than by variations in V/σ, we investigated the correlation between V/σ and the asymmetry parameter in our sample. Overall, we find no significant correlations in either the stellar or gaseous kinematic maps. To investigate this further, we split our sample into stellar mass bins. The results remain largely unchanged; only in the high-mass end (M★ ≥ 1010.8 M⊙) the Pearson coefficient suggests a correlation between the stellar asymmetry parameter and the stellar V/σ within 1Reff. In this high-mass population, we note that the observed fraction of dry mergers we show in Sect. 4.2 may be influenced by variations in V/σ. For the gaseous component, we do not find a clear correlation in any mass bin, providing additional support for our main conclusions. We further investigate the connection between stellar kinematic asymmetry and the galaxy’s dynamical state by separating our sample into fast and slow rotators using the spin parameter λRe. Following the established λRe–ϵ classification8 (e.g., Emsellem et al. 2011), we find that within our sample of galaxies with λRe measurements (2897) available in Argudo-Fernández et al. (2015), 241 (8.3%) are classified as slow rotators and 2656 (91.7%) as fast rotators. The mean stellar kinematic asymmetry for slow rotators is significantly higher (⟨Iasym⟩slow = 0.147 ± 0.089) than for fast rotators (⟨Iasym⟩fast = 0.047 ± 0.044). This clear dichotomy supports the interpretation that the kinematic asymmetries reported in this work are more fundamentally tied to interactions. Slow rotators are thought to form through violent interactions during mergers–particularly dry, intermediate-to-major mergers–which can both build stellar mass and produce the observed kinematic asymmetries (e.g., Hoffman et al. 2010; Bois et al. 2011; Naab et al. 2014; Lagos et al. 2022). Observationally, slow rotators have been linked to merger histories and signs of kinematic disturbance (e.g., Ene et al. 2018; Krajnović et al. 2020; Loubser et al. 2022). The enhanced asymmetry we find in slow rotators therefore reinforces our conclusion that environmental effects–specifically merger-driven growth–are the dominant driver of the observed kinematic asymmetries in quenched central galaxies.
5.3. Summary
In this work we presented a novel case-by-case analysis of kinematic asymmetries in a robust sample of 6,680 nearby galaxies (z < 0.15) to disentangle the relative prevalence of different quenching mechanisms. For the first time, we systematically evaluated a comprehensive suite of processes–including AGN activity, ram pressure stripping, tidal interactions, minor and dry mergers, secular evolution, galaxy harassment, starvation (in satellites), and feedback quenching maintenance (in centrals)–as potential drivers of the observed kinematics, and treated them as equally probable a priori in order to provide an unbiased assessment of their roles in galaxy evolution. We summarize below the main conclusions of this work.
-
The absence of kinematically asymmetric satellites in the satellite region of the SFR-M★ plane strongly suggests that whatever is driving down the star formation in local (z ≲ 0.2) star-forming satellites does not significantly perturb either the stellar or the gaseous structures.
-
Our analysis reveals that the most common quenching mechanisms leave minimal imprints on stellar kinematics by the time a galaxy is fully quenched. This kinematic regularity itself is a crucial diagnostic, pointing toward slow-acting processes (≳3 Gyr) such as starvation and/or strangulation and maintenance feedback over violent, recent events.
-
We establish a clear link between quenching history and galaxy size. Quenched satellites are significantly more compact than quenched centrals at fixed mass, a signature consistent with outer disk stripping by rapid environmental effects (e.g., gas stripping, tidal interactions). Conversely, the larger sizes of disturbed, quenched centrals strongly support a merger-driven growth scenario. Furthermore, our results suggest that internal processes, likely mediated by AGN feedback over the past 1–3 Gyr that prevented hot halo gas from cooling, lead to sustained quenching maintenance in this central population, in contrast to satellites.
-
The dominant pathway for quenching satellite galaxies is environmentally driven. A sequence of rapid gas stripping and tidal interactions followed by long-term starvation effectively explains the observed population of compact, kinematically regular, and fully quenched satellites, as revealed by our mass-matching analysis.
Data availability
The MaNGA data underlying this article are publicly available and can be accessed from the SDSS data base: https://www.sdss.org/dr15/manga/manga-data/data-access/, or through MARVIN at https://dr17.sdss.org/marvin/.
Acknowledgments
We would like to thank the anonymous referee for a productive report with comments and suggestions that improved this paper. NdI gratefully acknowledges the IMPRS program and ESO for the support and funding of his PhD. PP, IM and VT acknowledge financial support from the European Research Council (ERC) under the European Union’s Horizon Europe research and innovation programme ERC CoG CLEVeR (Grant agreement No. 101045437). YMB acknowledges support from UK Research and Innovation through a Future Leaders Fellowship (grant agreement MR/X035166/1) and financial support from the Swiss National Science Foundation (SNSF) under project 200021_213076.
References
- Abdurro’uf, Accetta, K., Aerts, C., et al. 2022, ApJS, 259, 35 [NASA ADS] [CrossRef] [Google Scholar]
- Aghanim, N., Akrami, Y., Ashdown, M., et al. 2020, A&A, 641, A6 [NASA ADS] [CrossRef] [EDP Sciences] [Google Scholar]
- Argudo-Fernández, M., Verley, S., Bergond, G., et al. 2015, A&A, 578, A110 [NASA ADS] [CrossRef] [EDP Sciences] [Google Scholar]
- Bagge, R. S., Foster, C., Battisti, A., et al. 2023, PASA, 40, e060 [Google Scholar]
- Bagge, R. S., Foster, C., D’Eugenio, F., et al. 2024, MNRAS, 531, 3011 [Google Scholar]
- Baxter, D. C., Fillingham, S. P., Coil, A. L., & Cooper, M. C. 2025, ApJ, 979, 41 [Google Scholar]
- Behroozi, P. S., Conroy, C., & Wechsler, R. H. 2010, ApJ, 717, 379 [Google Scholar]
- Behroozi, P. S., Wechsler, R. H., & Conroy, C. 2013, ApJ, 770, 57 [NASA ADS] [CrossRef] [Google Scholar]
- Behroozi, P., Wechsler, R. H., Hearin, A. P., & Conroy, C. 2019, MNRAS, 488, 3143 [NASA ADS] [CrossRef] [Google Scholar]
- Belfiore, F., Westfall, K. B., Schaefer, A., et al. 2019, AJ, 158, 160 [CrossRef] [Google Scholar]
- Blanton, M. R., Bershady, M. A., Abolfathi, B., et al. 2017, AJ, 154, 28 [Google Scholar]
- Bloom, J. V., Fogarty, L. M. R., Croom, S. M., et al. 2017, MNRAS, 465, 123 [Google Scholar]
- Bloom, J. V., Croom, S. M., Bryant, J. J., et al. 2018, MNRAS, 476, 2339 [Google Scholar]
- Bluck, A. F. L., Maiolino, R., Piotrowska, J. M., et al. 2020, MNRAS, 499, 230 [NASA ADS] [CrossRef] [Google Scholar]
- Bois, M., Emsellem, E., Bournaud, F., et al. 2011, MNRAS, 416, 1654 [Google Scholar]
- Brown, T., Catinella, B., Cortese, L., et al. 2017, MNRAS, 466, 1275 [Google Scholar]
- Bundy, K., Bershady, M. A., Law, D. R., et al. 2015, ApJ, 798, 7 [Google Scholar]
- Cappellari, M., & Emsellem, E. 2004, PASP, 116, 138 [Google Scholar]
- Comerford, J. M., Nevin, R., Negus, J., et al. 2024, ApJ, 963, 53 [NASA ADS] [CrossRef] [Google Scholar]
- Cortese, L., van de Sande, J., Lagos, C. P., et al. 2019, MNRAS, 485, 2656 [Google Scholar]
- Cortese, L., Catinella, B., & Smith, R. 2021, PASA, 38, e035 [NASA ADS] [CrossRef] [Google Scholar]
- Croton, D. J., Springel, V., White, S. D. M., et al. 2006, MNRAS, 365, 11 [Google Scholar]
- de Isídio, N. G., Menéndez-Delmestre, K., Gonçalves, T. S., et al. 2024, ApJ, 971, 69 [Google Scholar]
- Dekel, A., & Birnboim, Y. 2006, MNRAS, 368, 2 [NASA ADS] [CrossRef] [Google Scholar]
- Di Teodoro, E. M., & Fraternali, F. 2015, MNRAS, 451, 3021 [Google Scholar]
- Di Teodoro, E. M., & Peek, J. E. G. 2021, ApJ, 923, 220 [NASA ADS] [CrossRef] [Google Scholar]
- Domínguez Sánchez, H., Margalef, B., Bernardi, M., & Huertas-Company, M. 2022, MNRAS, 509, 4024 [Google Scholar]
- Drory, N., MacDonald, N., Bershady, M. A., et al. 2015, AJ, 149, 77 [CrossRef] [Google Scholar]
- Eke, V. R., Baugh, C. M., Cole, S., et al. 2004, MNRAS, 348, 866 [NASA ADS] [CrossRef] [Google Scholar]
- Emsellem, E., Cappellari, M., Krajnović, D., et al. 2011, MNRAS, 414, 888 [Google Scholar]
- Ene, I., Ma, C.-P., Veale, M., et al. 2018, MNRAS, 479, 2810 [Google Scholar]
- Fabian, A. C. 2012, ARA&A, 50, 455 [Google Scholar]
- Falcón-Barroso, J., Sánchez-Blázquez, P., Vazdekis, A., et al. 2011, A&A, 532, A95 [Google Scholar]
- Feng, S., Shen, S.-Y., Yuan, F.-T., Dai, Y. S., & Masters, K. L. 2022, ApJS, 262, 6 [Google Scholar]
- Gallazzi, A., Charlot, S., Brinchmann, J., White, S. D. M., & Tremonti, C. A. 2005, MNRAS, 362, 41 [Google Scholar]
- Giovanelli, R., Haynes, M. P., Kent, B. R., et al. 2005, AJ, 130, 2598 [Google Scholar]
- Gunn, J. E., & Gott, J. R., III 1972, ApJ, 176, 1 [Google Scholar]
- Gunn, J. E., Siegmund, W. A., Mannery, E. J., et al. 2006, AJ, 131, 2332 [NASA ADS] [CrossRef] [Google Scholar]
- Hoffman, L., Cox, T. J., Dutta, S., & Hernquist, L. 2010, ApJ, 723, 818 [Google Scholar]
- Holmes, L., Spekkens, K., Sánchez, S. F., et al. 2015, MNRAS, 451, 4397 [NASA ADS] [CrossRef] [Google Scholar]
- Jaffé, Y. L., Poggianti, B. M., Moretti, A., et al. 2018, MNRAS, 476, 4753 [Google Scholar]
- Kang, X., & van den Bosch, F. C. 2008, ApJ, 676, L101 [Google Scholar]
- Kauffmann, G., Heckman, T. M., Tremonti, C., et al. 2003, MNRAS, 346, 1055 [Google Scholar]
- Kewley, L. J., Groves, B., Kauffmann, G., & Heckman, T. 2006, MNRAS, 372, 961 [Google Scholar]
- Krajnović, D., Cappellari, M., de Zeeuw, P. T., & Copin, Y. 2006, MNRAS, 366, 787 [Google Scholar]
- Krajnović, D., Emsellem, E., Cappellari, M., et al. 2011, MNRAS, 414, 2923 [Google Scholar]
- Krajnović, D., Ural, U., Kuntschner, H., et al. 2020, A&A, 635, A129 [NASA ADS] [CrossRef] [EDP Sciences] [Google Scholar]
- Lackner, C. N., Cen, R., Ostriker, J. P., & Joung, M. R. 2012, MNRAS, 425, 641 [NASA ADS] [CrossRef] [Google Scholar]
- Lagos, C. d. P., Emsellem, E., van de Sande, J., et al. 2022, MNRAS, 509, 4372 [Google Scholar]
- Larson, R. B., Tinsley, B. M., & Caldwell, C. N. 1980, ApJ, 237, 692 [Google Scholar]
- Lee, J. H., Lee, M. G., Mun, J. Y., Cho, B. S., & Kang, J. 2022, ApJ, 940, 24 [Google Scholar]
- Leung, H. H., Wild, V., Papathomas, M., Carnall, A. C., & Chen, Y. 2025, MNRAS [Google Scholar]
- Liu, G., Zakamska, N. L., Greene, J. E., Nesvadba, N. P. H., & Liu, X. 2013, MNRAS, 436, 2576 [NASA ADS] [CrossRef] [Google Scholar]
- Lotz, J. M., Jonsson, P., Cox, T. J., & Primack, J. R. 2008, MNRAS, 391, 1137 [Google Scholar]
- Loubser, S. I., Lagos, P., Babul, A., et al. 2022, MNRAS, 515, 1104 [NASA ADS] [CrossRef] [Google Scholar]
- Marini, I., Popesso, P., Dolag, K., et al. 2025, A&A, 694, A207 [NASA ADS] [CrossRef] [EDP Sciences] [Google Scholar]
- Masters, K. L., Stark, D. V., Pace, Z. J., et al. 2019, MNRAS, 488, 3396 [Google Scholar]
- Moore, B., Lake, G., & Katz, N. 1998, ApJ, 495, 139 [Google Scholar]
- Naab, T., Johansson, P. H., & Ostriker, J. P. 2009, ApJ, 699, L178 [Google Scholar]
- Naab, T., Oser, L., Emsellem, E., et al. 2014, MNRAS, 444, 3357 [Google Scholar]
- Ni, Y., Chen, N., Zhou, Y., et al. 2025, ApJ, 990, 120 [Google Scholar]
- Pasquali, A., Gallazzi, A., Fontanot, F., et al. 2010, MNRAS, 407, 937 [NASA ADS] [CrossRef] [Google Scholar]
- Peng, Y., Maiolino, R., & Cochrane, R. 2015, Nature, 521, 192 [Google Scholar]
- Poggianti, B. M., Moretti, A., Gullieuszik, M., et al. 2017, ApJ, 844, 48 [Google Scholar]
- Poggianti, B. M., Ignesti, A., Gitti, M., et al. 2019, ApJ, 887, 155 [Google Scholar]
- Poggianti, B. M., Vulcani, B., Tomicic, N., et al. 2025, A&A, 699, A357 [NASA ADS] [CrossRef] [EDP Sciences] [Google Scholar]
- Popesso, P., Concas, A., Morselli, L., et al. 2019, MNRAS, 483, 3213 [Google Scholar]
- Roberts, I. D., van Weeren, R. J., McGee, S. L., et al. 2021, A&A, 652, A153 [NASA ADS] [CrossRef] [EDP Sciences] [Google Scholar]
- Sánchez, S. F., Barrera-Ballesteros, J. K., Lacerda, E., et al. 2022, ApJS, 262, 36 [CrossRef] [Google Scholar]
- Sánchez-Blázquez, P., Peletier, R. F., Jiménez-Vicente, J., et al. 2006, MNRAS, 371, 703 [Google Scholar]
- Sánchez-García, O., Cervantes Sodi, B., Fritz, J., et al. 2023, ApJ, 945, 99 [CrossRef] [Google Scholar]
- Shapiro, K. L., Genzel, R., Förster Schreiber, N. M., et al. 2008, ApJ, 682, 231 [NASA ADS] [CrossRef] [Google Scholar]
- Simons, R. C., Kassin, S. A., Snyder, G. F., et al. 2019, ApJ, 874, 59 [Google Scholar]
- Slater, R., Nagar, N. M., Schnorr-Müller, A., et al. 2019, A&A, 621, A83 [NASA ADS] [CrossRef] [EDP Sciences] [Google Scholar]
- Smee, S. A., Gunn, J. E., Uomoto, A., et al. 2013, AJ, 146, 32 [Google Scholar]
- Smith, R. J., Lucey, J. R., Hammer, D., et al. 2010, MNRAS, 408, 1417 [Google Scholar]
- Smith, R., Calderón-Castillo, P., Shin, J., Raouf, M., & Ko, J. 2022, AJ, 164, 95 [NASA ADS] [CrossRef] [Google Scholar]
- Stark, D. V., Masters, K. L., Avila-Reese, V., et al. 2021, MNRAS, 503, 1345 [NASA ADS] [CrossRef] [Google Scholar]
- Tempel, E., Guo, Q., Kipper, R., & Libeskind, N. I. 2015, MNRAS, 450, 2727 [NASA ADS] [CrossRef] [Google Scholar]
- Tinker, J. L. 2021, ApJ, 923, 154 [NASA ADS] [CrossRef] [Google Scholar]
- Trussler, J., Maiolino, R., Maraston, C., et al. 2020, MNRAS, 491, 5406 [Google Scholar]
- van den Bosch, F. C., Aquino, D., Yang, X., et al. 2008, MNRAS, 387, 79 [Google Scholar]
- Vollmer, B., Cayatte, V., Balkowski, C., & Duschl, W. J. 2001, ApJ, 561, 708 [NASA ADS] [CrossRef] [Google Scholar]
- Vulcani, B., Poggianti, B. M., Gullieuszik, M., et al. 2018a, ApJ, 866, L25 [Google Scholar]
- Vulcani, B., Poggianti, B. M., Jaffé, Y. L., et al. 2018b, MNRAS, 480, 3152 [NASA ADS] [CrossRef] [Google Scholar]
- Vulcani, B., Poggianti, B. M., Moretti, A., et al. 2021, ApJ, 914, 27 [NASA ADS] [CrossRef] [Google Scholar]
- Vulcani, B., Poggianti, B. M., Smith, R., et al. 2022, ApJ, 927, 91 [NASA ADS] [CrossRef] [Google Scholar]
- Wang, B., Cappellari, M., Peng, Y., & Graham, M. 2020, MNRAS, 495, 1958 [NASA ADS] [CrossRef] [Google Scholar]
- Wang, B., Peng, Y., Cappellari, M., Gao, H., & Mo, H. 2024, ApJ, 973, L29 [Google Scholar]
- Westfall, K. B., Cappellari, M., Bershady, M. A., et al. 2019, AJ, 158, 231 [Google Scholar]
- Wetzel, A. R., Tinker, J. L., & Conroy, C. 2012, MNRAS, 424, 232 [NASA ADS] [CrossRef] [Google Scholar]
- Yang, X., Mo, H. J., van den Bosch, F. C., & Jing, Y. P. 2005, MNRAS, 356, 1293 [Google Scholar]
- Yang, X., Mo, H. J., van den Bosch, F. C., et al. 2007, ApJ, 671, 153 [Google Scholar]
- Yang, X., Xu, H., He, M., et al. 2021, ApJ, 909, 143 [NASA ADS] [CrossRef] [Google Scholar]
Reff is defined as the radius containing half the galaxy’s i-band luminosity.
Available at: https://greenbankobservatory.org/science/gbt-surveys/hi-manga/
The package is available at: https://www.aip.de/en/members/davor-krajnovic/kinemetry/
Data accessed via the ESO archive: archive.eso.org
Set by IFU size, from 19 to 127 fibers.
Here, the cold gas fraction is defined as the ratio between the H I gas mass and the stellar mass (MHI/M★).
Fast rotators have  , where ϵ is the galaxy’s ellipticity, following Emsellem et al. (2011).
Appendix A: Signal-to-noise ratio of MaNGA data
As we mention in Sect. 2.4, all spaxels taken into account in both gaseous and stellar velocity maps analyzed in this work must have at least a minumum S/N of 5. For each MaNGA galaxy, we calculate the S/N of the Hα line following Eq. (1) from Belfiore et al. (2019),
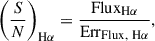 (A.1)
(A.1)
where ErrFlux, Hα is the error on the flux of the Hα line. Similarly, we calculate the S/N per spaxel as
 (A.2)
(A.2)
where Fluxspaxel is the flux intensity (in our case, either Hα or stellar continuum), and  is the inverse variance of the flux as provided by MaNGA Data Analysis Pipeline. Spaxels with S/N ≥ 5 were considered valid for subsequent KINEMETRY analysis. Spaxels below this threshold were masked (set to NaN) in the velocity maps before performing the asymmetry calculations. This S/N-based masking ensures that only reliable measurements contribute to the kinematic asymmetry analysis, minimizing noise contamination in the results. Examples of S/N maps are displayed in the second and fourth panels of Fig. A.1 for Hα and stellar velocity maps, respectively. All galaxies analyzed in this work have at least 90% of valid spaxels within 1 Reff.
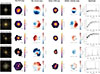 |
Fig. A.1. Examples of galaxies with different levels of kinematic asymmetry from the most kinematically symmetric (top panels) to the most asymmetric (bottom panels). First column: Stellar emission maps of the galaxy from SDSS. Second column: Average S/N map of the Hα emission. Third column: Hα velocity map of each galaxy along with its corresponding asymmetry parameter. Fourth column: Average S/N map of the stellar component. Fifth column: Stellar velocity map of each galaxy along with its corresponding asymmetry parameter. Sixth column: Spectrum of each galaxy showing emission lines (particularly prominent in the last two rows) and stellar absorption features. The yellow circle displayed in the second and fourth columns corresponds to 1 Reff of the galaxy. The white background corresponds to spaxels with S/N < 5. |
Appendix B: KINEMETRY on GASP data
As discussed in Sect. 3.2, we analyzed 23 randomly selected galaxies from the GAs Stripping Phenomena in galaxies with MUSE (GASP) survey to enable a direct comparison of the detectability of ram pressure features in limited-field-of-view (FoV) surveys such as MaNGA. We present in Fig. B.1 the kinematic map of JO206, showing the characteristic jellyfish tails as observed by the GASP FoV (top panel).
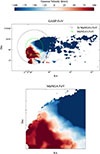 |
Fig. B.1. Three different apertures matching the GASP FoV (original data; top panel) and MaNGA’s average FoV (bottom panel) for the jellyfish galaxy JO206. As shown in the bottom panel, using only MaNGA’s average FoV would miss the tail-like substructure, resulting in the expected lower asymmetry parameter highlighted in Fig. B.2. |
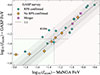 |
Fig. B.2. Comparison of the asymmetry indices of GASP galaxies calculated applying a limited aperture with both the average (∼24 arcsec) FoV of the MaNGA survey (x-axis) and the FoV of GASP survey (y-axis). We highlight in red the GASP galaxies with strong jellyfish features in the kinematic maps. Except for JO206 (Fig. B.1), JO171, and JW100, we verify that the asymmetry estimates show good agreement within a 2σ confidence interval. |
GASP galaxies analyzed in this work.
Appendix C: AGN contribution
Outflows from AGN or star formation could also disturb gas while leaving stars unaffected (i.e., Case 3 in Sect. 4.2). To test this, we cross-matched our subsample of gaseous kinematically disturbed galaxies with the MaNGA AGN catalog (Comerford et al. 2024). We highlight the cross-matched galaxies (i.e., those with gaseous asymmetries and a confirmed AGN) with black contours in Fig. C.1. In the top panel of Fig. C.2, we show the stacked spectrum of 20 randomly selected AGN host galaxies. We centered the emission on the Hα line to search for a potential broad component that could arise from AGN outflows.
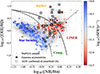 |
Fig. C.1. BPT diagram for galaxies exhibiting asymmetries in both gaseous and stellar components. Galaxies confirmed as AGN hosts from Comerford et al. (2024) are highlighted with black square contours overlaid on the data points. The dashed and solid lines indicate the AGN from star-forming galaxies based on the BPT classification from Kauffmann et al. (2003) and Kewley et al. (2006), respectively. |
For galaxies with gaseous kinematic asymmetries but no confirmed AGN, we also analyzed their stacked spectrum and found that it is well fitted by a single Gaussian, suggesting no broadening in the Hα line. This is displayed for both non-AGN confirmed, quenched galaxies (middle panel of Fig. C.2) and non-AGN confirmed, star-forming galaxies (bottom panel of Fig. C.2).
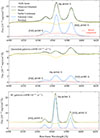 |
Fig. C.2. Top panel: Stacked spectrum of 20 randomly selected AGN host galaxies, as confirmed by Comerford et al. (2024). This reveals a broad Hα component that is likely linked with outflows, which might be causing the observed kinematic gaseous asymmetries. Middle panel: Stacked spectrum of quenched galaxies showing no visible broad component. Bottom panel: Perfect single Gaussian fitting for emission lines without any potential outflow contribution. |
All Tables
All Figures
|
Fig. 1. Distribution of our sample of galaxies in the SFR-M★ plane, color-coded by the fraction of satellites. As expected, the highest satellite fractions are found among quiescent galaxies with M★ ≲ 1010.5 M⊙, a region we refer to as the satellite region. The lines indicate the boundaries separating star-forming, green valley, and quiescent galaxies, as presented in Behroozi et al. (2019). |
| In the text | |
|
Fig. 2. Left panel: Stellar mass distribution of our MaNGA sample including both central and satellite galaxies. Middle panel: Halo mass distribution of our sample separated by centrals or satellites. Right panel: Fraction of centrals and satellites per stellar mass bin. In all panels, we show the representativeness of our sample by comparing it to SDSS spectroscopic sample complete in stellar mass down to 1010 M⊙ at z ∼ 0.085. |
| In the text | |
|
Fig. 3. SFR–M★ plane of our galaxy sample, color-coded by the S/N of each individual object. The top panel shows our subsample with reliable stellar velocity maps (i.e., maps with ≥90% valid spaxels within 1Reff). The bottom panel shows galaxies with reliable gaseous velocity maps. The lines indicate the boundaries separating star-forming, green valley, and quiescent galaxies, as defined in Behroozi et al. (2019). |
| In the text | |
|
Fig. 4. Top panel: Distribution of galaxies with KINEMETRY info on the stellar component in the SFR-M★ plane, color-coded by the average asymmetry parameter of the stellar kinematic map. As in Fig. 3, the lines indicate the boundaries separating star-forming, green valley, and quiescent galaxies as present in Behroozi et al. (2019). The upper curves indicate the PDF of galaxies classified as asymmetric according to different KINEMETRY thresholds in Iasym. Bottom panel: As in the upper panel, but for galaxies with KINEMETRY info on the gaseous component. |
| In the text | |
|
Fig. 5. Panel (a): sSFR-M★ plane displaying all symmetric galaxies (Iasym = 0.05) in our sample, including centrals and satellites. Panels (b) and (c): Galaxies with kinematic asymmetries in the stellar component (b) and gaseous component (c). Panel (d): Galaxies with asymmetries in both maps. Panels (e) and (f): Galaxies with asymmetries solely in stars (e) and gas (f). To guide the eye, we show the corresponding PDFs in the lower left corner of each panel. We also show a dashed red line separating quiescent and star-forming galaxies. Following our selection criteria, only galaxies with at least 90% of valid spaxels (spaxels with S/N★,gas > 5) are included. The absence of asymmetric galaxies in the satellite region of the (s)SFR–M★ plane (see also Fig. 1) strongly suggests that the mechanism suppressing star formation in our sample does not significantly impact the kinematic structure of the galaxy. |
| In the text | |
|
Fig. 6. Relative presence of the different quenching mechanisms analyzed in this work. Top panel: All values given relative to the subset of quenched galaxies (sSFR < 10−11 yr−1) with low gas fractions (MHI/M★ < 0.2). Bottom panel: Corresponding mechanisms identified in the star-forming subsample. Galaxies that do not meet the classification criteria are labeled “inconclusive”. The count of galaxies undergoing secular evolution (hatched bars in the bottom panel) is complemented by objects with symmetric gaseous kinematics but insufficient S/N in the stellar maps to classify that component as symmetric. |
| In the text | |
|
Fig. 7. Schematic summary of the SFR- and size-dependent results presented in Cases 5 and 6. Symmetric satellites exhibit the lowest SFRs and the most compact structures among quenched galaxies, suggesting that these objects are the end product of an intense period of mass removal, either via gas striping itself or tidal interactions. |
| In the text | |
|
Fig. A.1. Examples of galaxies with different levels of kinematic asymmetry from the most kinematically symmetric (top panels) to the most asymmetric (bottom panels). First column: Stellar emission maps of the galaxy from SDSS. Second column: Average S/N map of the Hα emission. Third column: Hα velocity map of each galaxy along with its corresponding asymmetry parameter. Fourth column: Average S/N map of the stellar component. Fifth column: Stellar velocity map of each galaxy along with its corresponding asymmetry parameter. Sixth column: Spectrum of each galaxy showing emission lines (particularly prominent in the last two rows) and stellar absorption features. The yellow circle displayed in the second and fourth columns corresponds to 1 Reff of the galaxy. The white background corresponds to spaxels with S/N < 5. |
| In the text | |
|
Fig. B.1. Three different apertures matching the GASP FoV (original data; top panel) and MaNGA’s average FoV (bottom panel) for the jellyfish galaxy JO206. As shown in the bottom panel, using only MaNGA’s average FoV would miss the tail-like substructure, resulting in the expected lower asymmetry parameter highlighted in Fig. B.2. |
| In the text | |
|
Fig. B.2. Comparison of the asymmetry indices of GASP galaxies calculated applying a limited aperture with both the average (∼24 arcsec) FoV of the MaNGA survey (x-axis) and the FoV of GASP survey (y-axis). We highlight in red the GASP galaxies with strong jellyfish features in the kinematic maps. Except for JO206 (Fig. B.1), JO171, and JW100, we verify that the asymmetry estimates show good agreement within a 2σ confidence interval. |
| In the text | |
|
Fig. C.1. BPT diagram for galaxies exhibiting asymmetries in both gaseous and stellar components. Galaxies confirmed as AGN hosts from Comerford et al. (2024) are highlighted with black square contours overlaid on the data points. The dashed and solid lines indicate the AGN from star-forming galaxies based on the BPT classification from Kauffmann et al. (2003) and Kewley et al. (2006), respectively. |
| In the text | |
|
Fig. C.2. Top panel: Stacked spectrum of 20 randomly selected AGN host galaxies, as confirmed by Comerford et al. (2024). This reveals a broad Hα component that is likely linked with outflows, which might be causing the observed kinematic gaseous asymmetries. Middle panel: Stacked spectrum of quenched galaxies showing no visible broad component. Bottom panel: Perfect single Gaussian fitting for emission lines without any potential outflow contribution. |
| In the text | |
Current usage metrics show cumulative count of Article Views (full-text article views including HTML views, PDF and ePub downloads, according to the available data) and Abstracts Views on Vision4Press platform.
Data correspond to usage on the plateform after 2015. The current usage metrics is available 48-96 hours after online publication and is updated daily on week days.
Initial download of the metrics may take a while.