


Fig. A.1.
Download original image
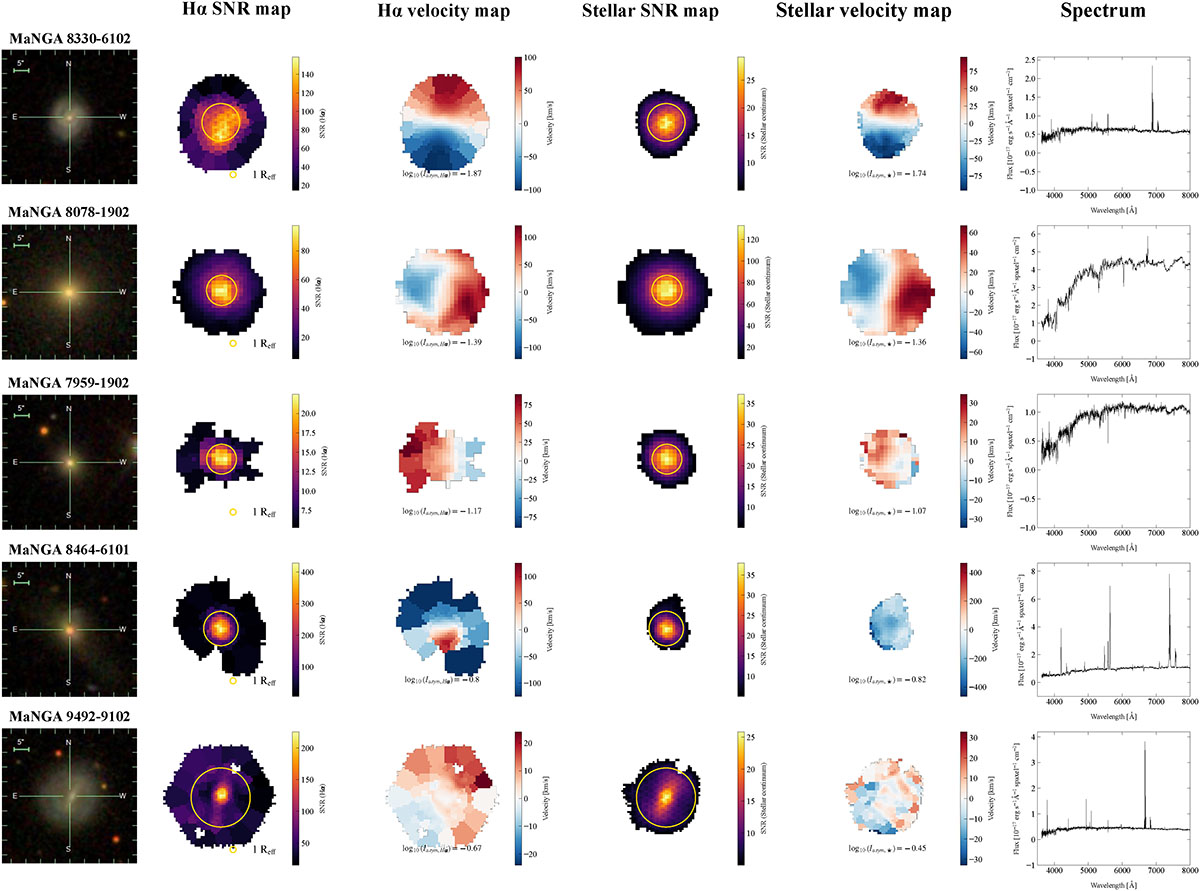
Examples of galaxies with different levels of kinematic asymmetry from the most kinematically symmetric (top panels) to the most asymmetric (bottom panels). First column: Stellar emission maps of the galaxy from SDSS. Second column: Average S/N map of the Hα emission. Third column: Hα velocity map of each galaxy along with its corresponding asymmetry parameter. Fourth column: Average S/N map of the stellar component. Fifth column: Stellar velocity map of each galaxy along with its corresponding asymmetry parameter. Sixth column: Spectrum of each galaxy showing emission lines (particularly prominent in the last two rows) and stellar absorption features. The yellow circle displayed in the second and fourth columns corresponds to 1 Reff of the galaxy. The white background corresponds to spaxels with S/N < 5.
Current usage metrics show cumulative count of Article Views (full-text article views including HTML views, PDF and ePub downloads, according to the available data) and Abstracts Views on Vision4Press platform.
Data correspond to usage on the plateform after 2015. The current usage metrics is available 48-96 hours after online publication and is updated daily on week days.
Initial download of the metrics may take a while.