


Fig. 3.
Download original image
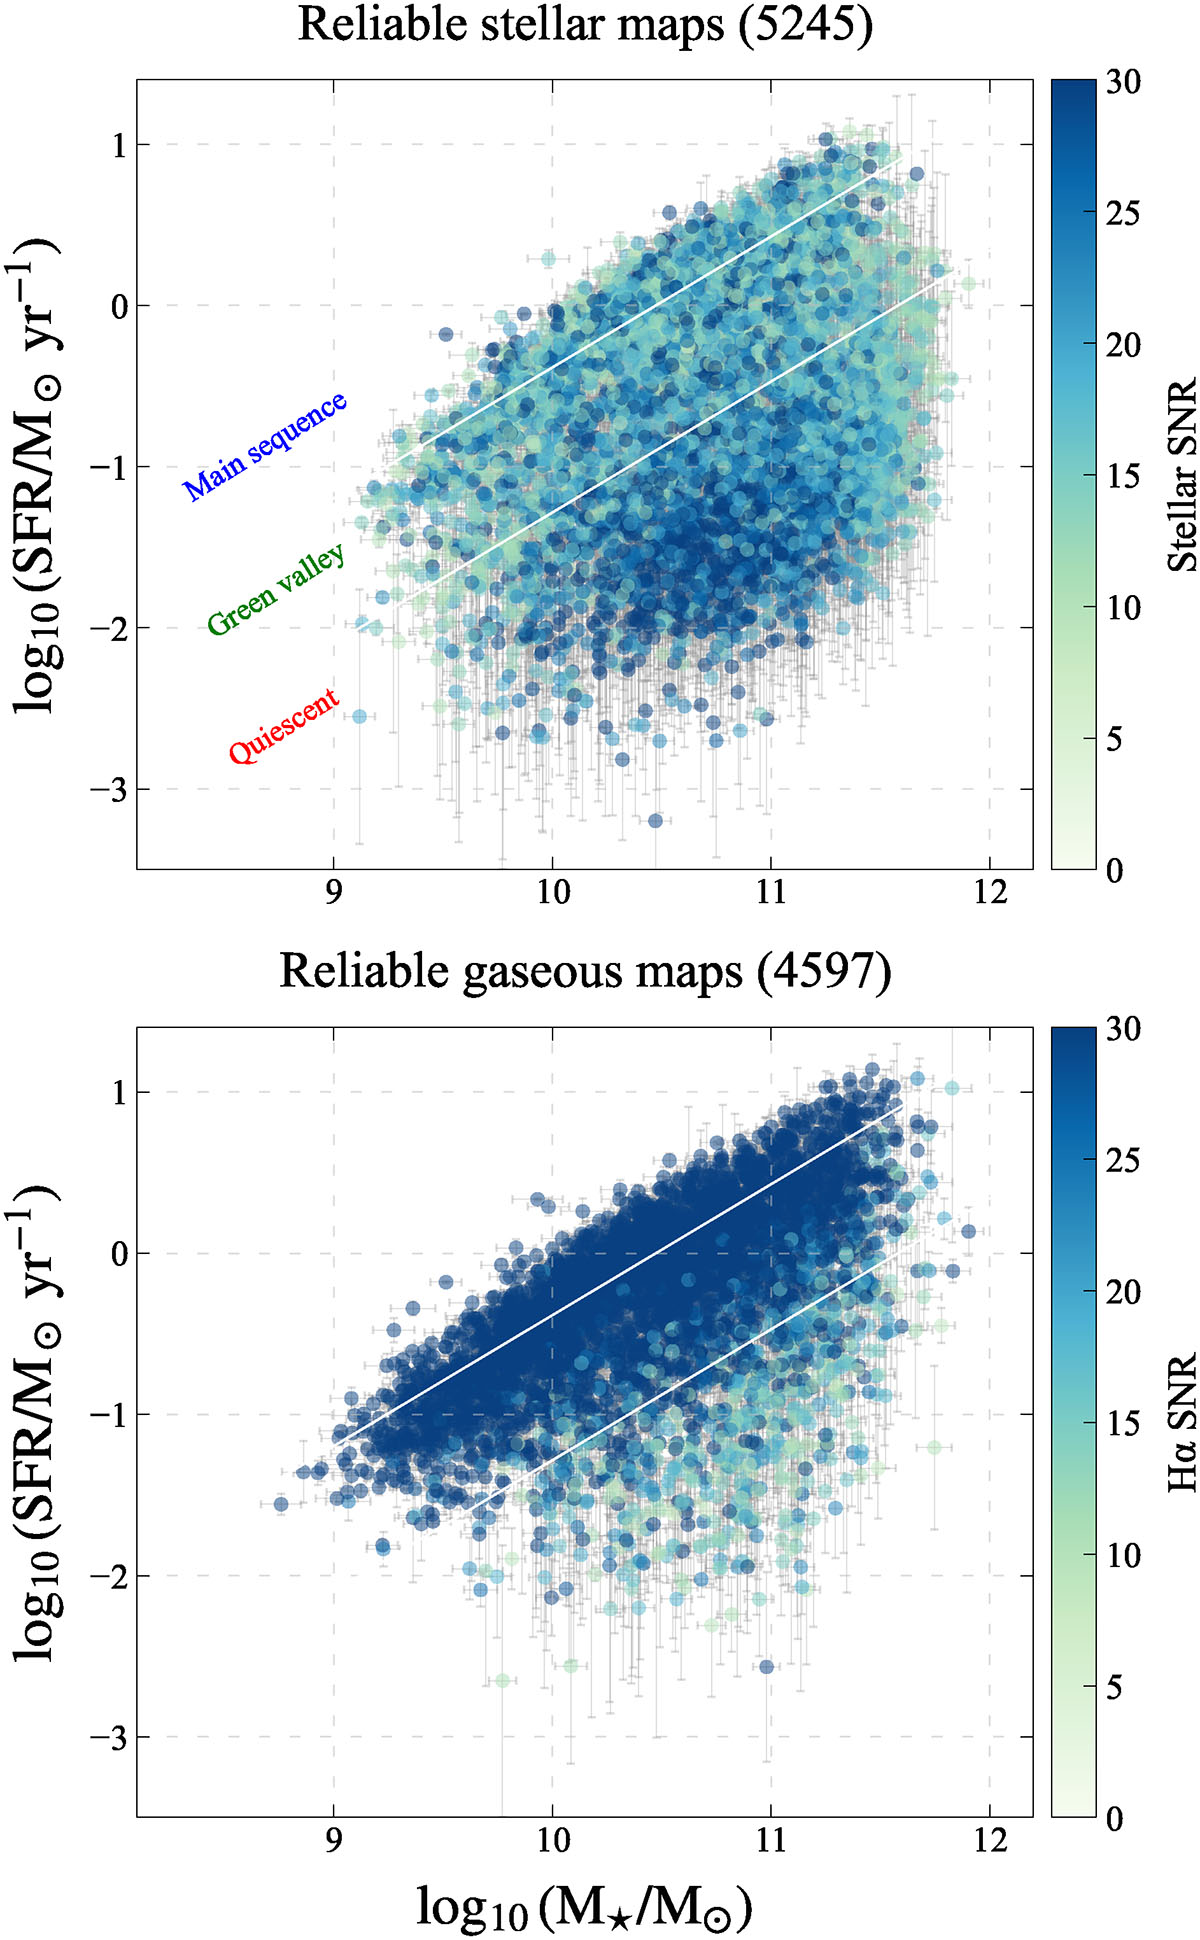
SFR–M★ plane of our galaxy sample, color-coded by the S/N of each individual object. The top panel shows our subsample with reliable stellar velocity maps (i.e., maps with ≥90% valid spaxels within 1Reff). The bottom panel shows galaxies with reliable gaseous velocity maps. The lines indicate the boundaries separating star-forming, green valley, and quiescent galaxies, as defined in Behroozi et al. (2019).
Current usage metrics show cumulative count of Article Views (full-text article views including HTML views, PDF and ePub downloads, according to the available data) and Abstracts Views on Vision4Press platform.
Data correspond to usage on the plateform after 2015. The current usage metrics is available 48-96 hours after online publication and is updated daily on week days.
Initial download of the metrics may take a while.