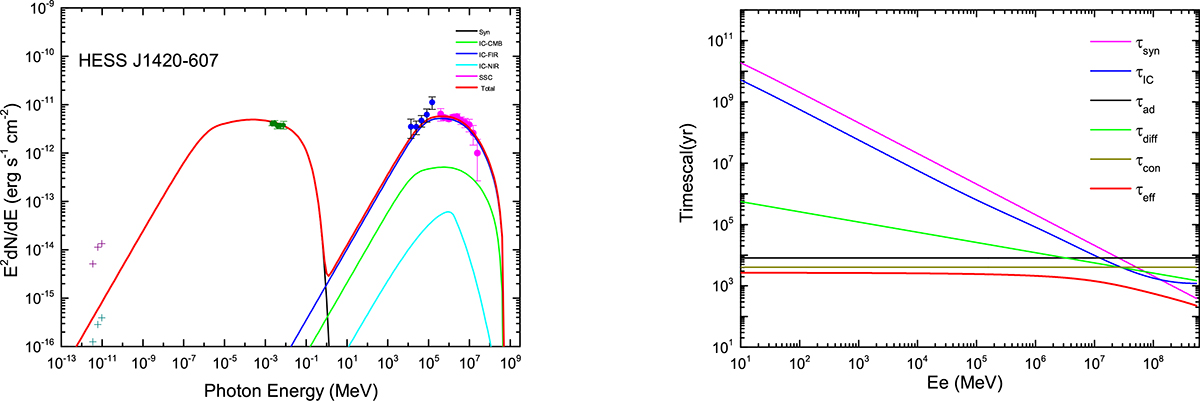
Fig. 2.
Download original image
Left panel: Comparison of calculated multiband SEDs with the observed data for HESS J1420−607. The dark cyan and purple data points display radio measurements from Roberts et al. (1999) and Van Etten & Romani (2010). The olive points show X-ray measurements (Van Etten & Romani 2010), the blue and magenta points respectively represent the Fermi-LAT data (Tian et al. 2023) and H.E.S.S. measurements (Aharonian et al. 2006). The black dashed line represents synchrotron SED; the blue, green, and dark yellow dashed lines represent the SEDs of inverse Compton scatterings with the IR, CMB, and starlight, respectively. Right panel: Different cooling and propagation timescales at the current time. The solid back, magenta, blue, green, dark yellow, and red lines represent the adiabatic loss timescale, synchrotron cooling timescale, inverse Compton cooling timescale, diffusion timescale, advection timescale, and total timescale, respectively.
Current usage metrics show cumulative count of Article Views (full-text article views including HTML views, PDF and ePub downloads, according to the available data) and Abstracts Views on Vision4Press platform.
Data correspond to usage on the plateform after 2015. The current usage metrics is available 48-96 hours after online publication and is updated daily on week days.
Initial download of the metrics may take a while.