Open Access
Fig. 9
Download original image
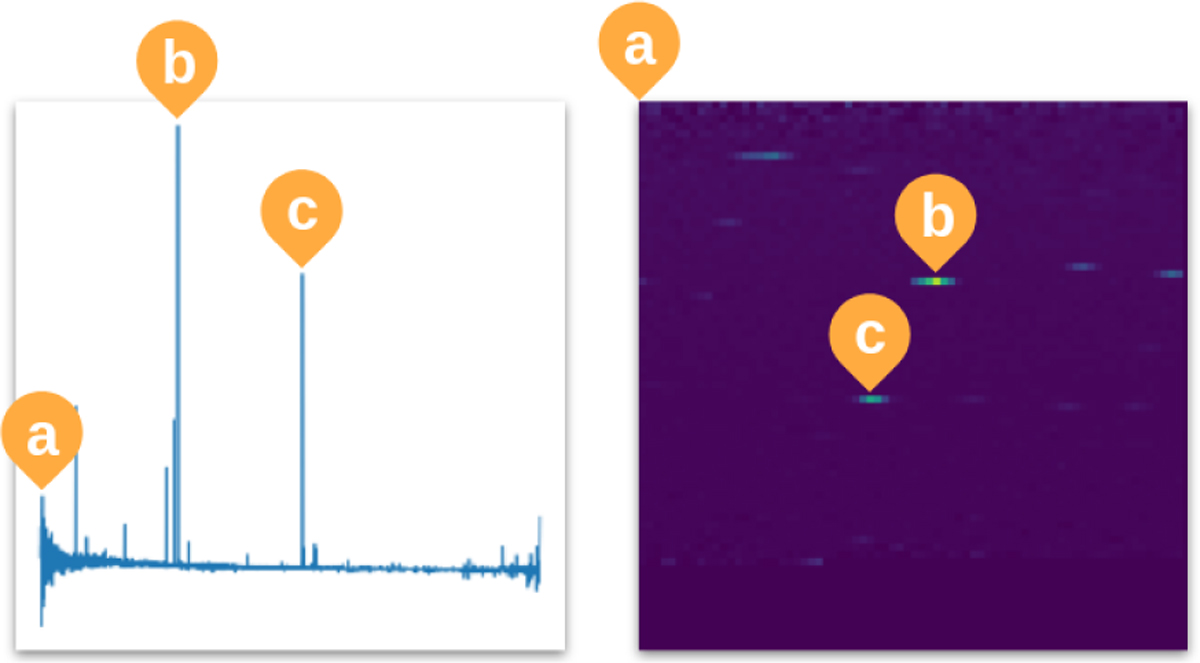
Overview of how each individual flux is mapped to the final 2D image in the 2D map design. Labels a, b, and c can be seen on the left in the standard flux plot, and in the right side with intensity set as the color of a given region in the image.
Current usage metrics show cumulative count of Article Views (full-text article views including HTML views, PDF and ePub downloads, according to the available data) and Abstracts Views on Vision4Press platform.
Data correspond to usage on the plateform after 2015. The current usage metrics is available 48-96 hours after online publication and is updated daily on week days.
Initial download of the metrics may take a while.