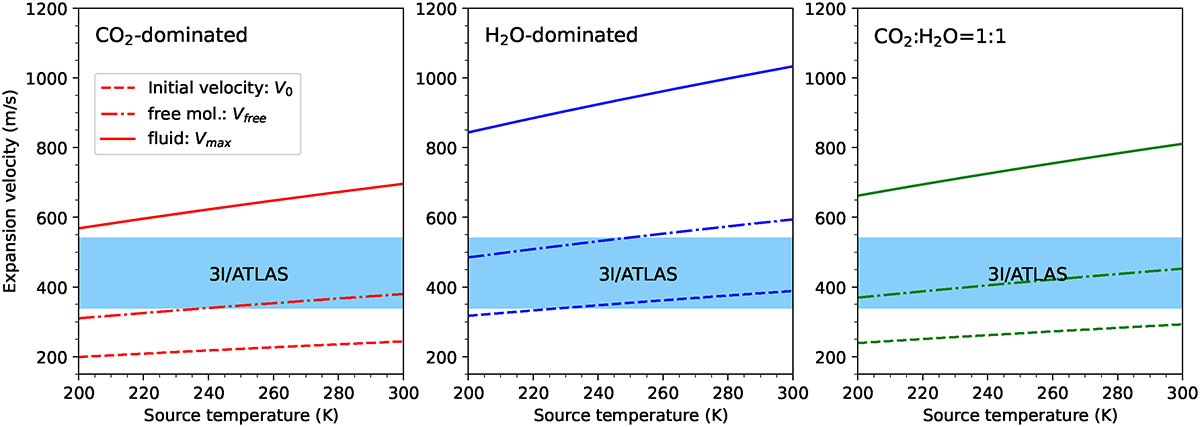
Fig. G.1.
Download original image
Initial velocity V0, maximal velocity Vmax, and terminal velocity for free-molecular expansion Vfree as a function of source temperature (TN). From left to right, CO2-dominated, H2O-dominated, and H2O-CO2 gas mixture. The range for 3I/ATLAS (in blue) delineates the expansion velocities measured in the blue and red wings of the line profiles (i.e. VHM values, see main text).
Current usage metrics show cumulative count of Article Views (full-text article views including HTML views, PDF and ePub downloads, according to the available data) and Abstracts Views on Vision4Press platform.
Data correspond to usage on the plateform after 2015. The current usage metrics is available 48-96 hours after online publication and is updated daily on week days.
Initial download of the metrics may take a while.