Fig. C.1.
Download original image
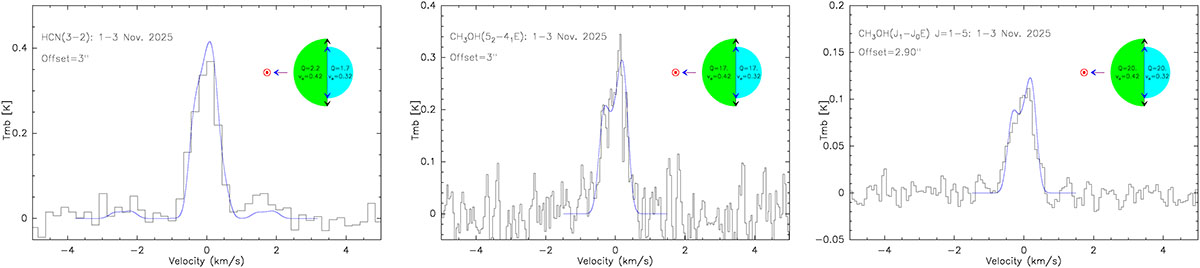
Synthetic line profiles (blue) superimposed on observed line profiles (black) of HCN (left panel) and CH3OH (middle and right panels). The inserts in the upper right of the plots show the assumed geometry of the outgassing with respect to the Sun direction, with the production rates given in units of 1025 molec. s−1 for HCN, and in units of 1026 molec. s−1 for CH3OH. The assumed expansion velocities (km s−1) in the sunward and antisunward hemispheres are also indicated. Thermal broadening assuming a kinetic temperature of 60 K (see main text) is considered.
Current usage metrics show cumulative count of Article Views (full-text article views including HTML views, PDF and ePub downloads, according to the available data) and Abstracts Views on Vision4Press platform.
Data correspond to usage on the plateform after 2015. The current usage metrics is available 48-96 hours after online publication and is updated daily on week days.
Initial download of the metrics may take a while.