Fig. 2
Download original image
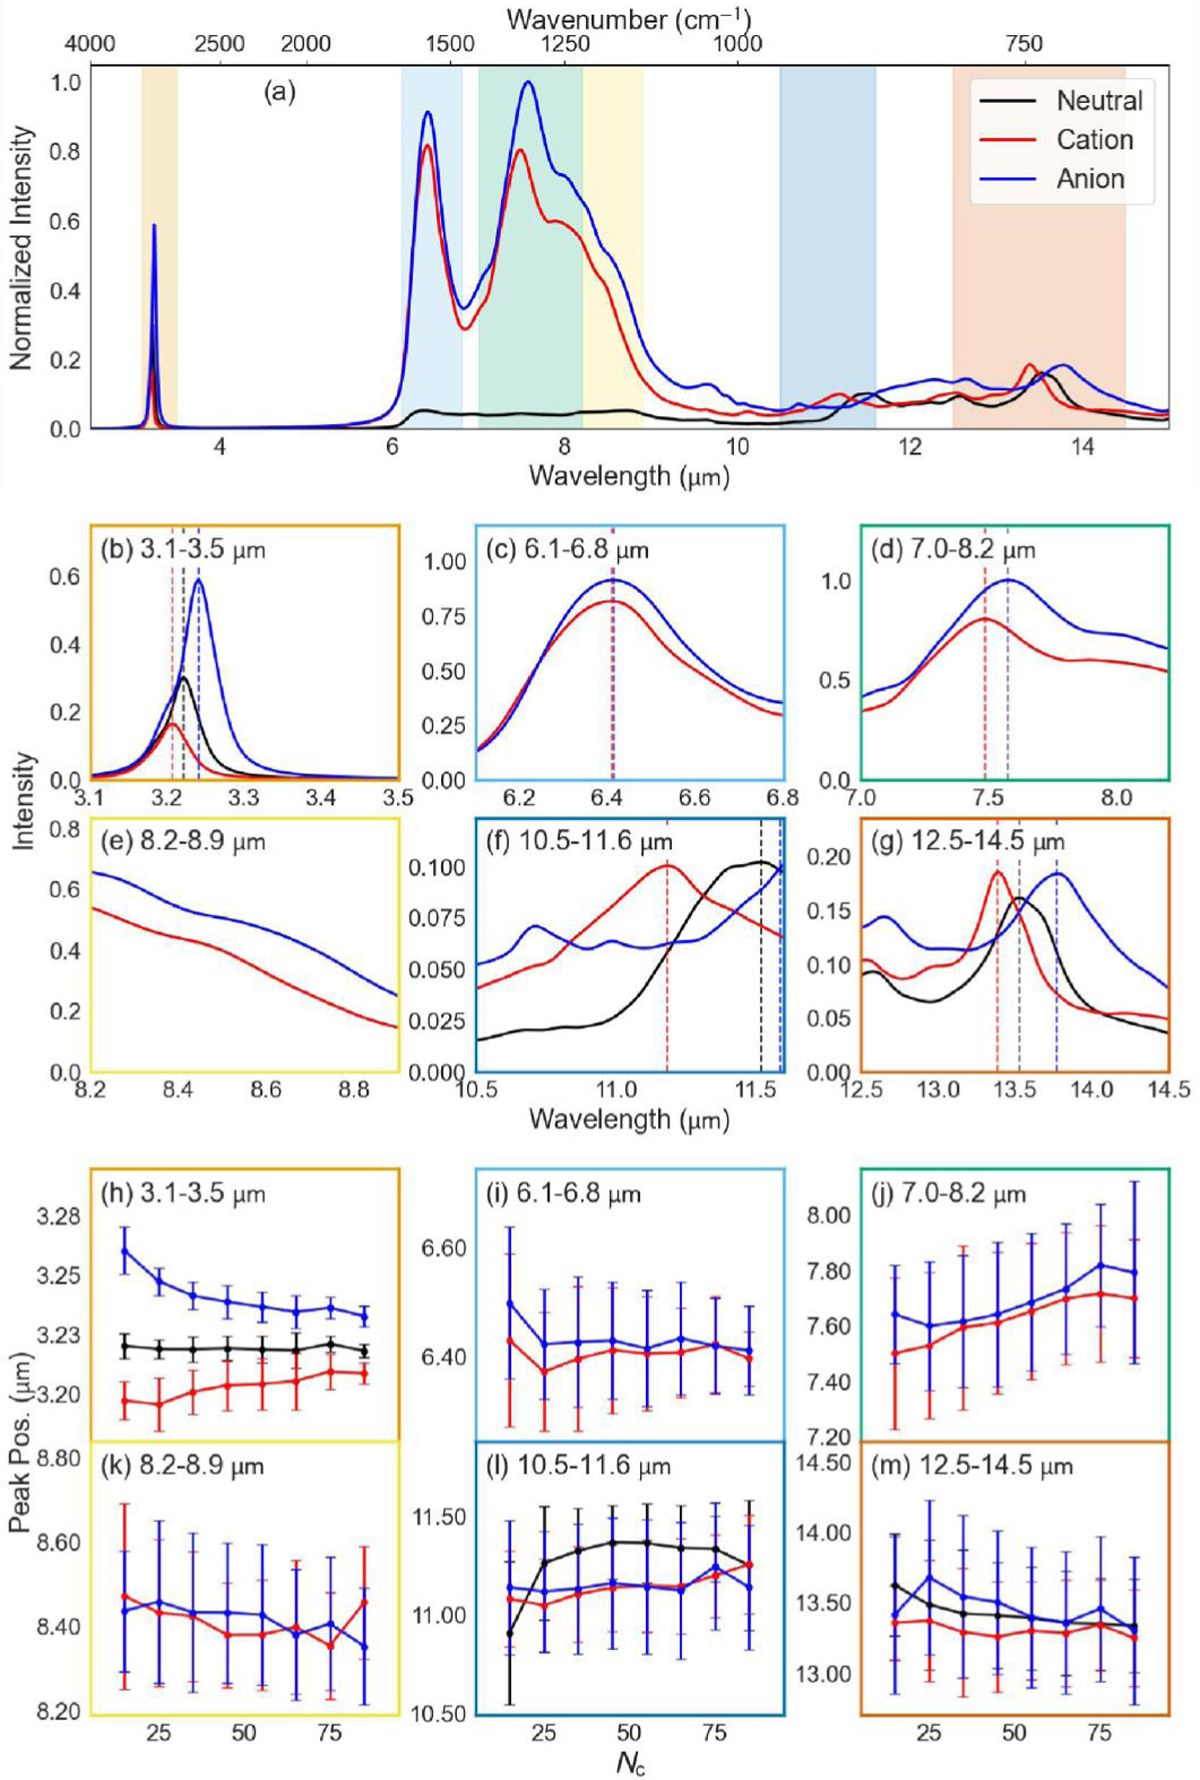
Statistical analysis of IR spectra for 3465 PAHs in neutral (black), cationic (red), and anionic (blue) states. (a) Mean spectra from 2.5 to 15 μm. Shaded regions highlight key AIBs. (b)–(g) Close-ups of major bands with peak positions marked. (h)-(m) Peak position vs. carbon atom count (NC). Points show binned averages, and error bars are standard deviations.
Current usage metrics show cumulative count of Article Views (full-text article views including HTML views, PDF and ePub downloads, according to the available data) and Abstracts Views on Vision4Press platform.
Data correspond to usage on the plateform after 2015. The current usage metrics is available 48-96 hours after online publication and is updated daily on week days.
Initial download of the metrics may take a while.