Fig. 6.
Download original image
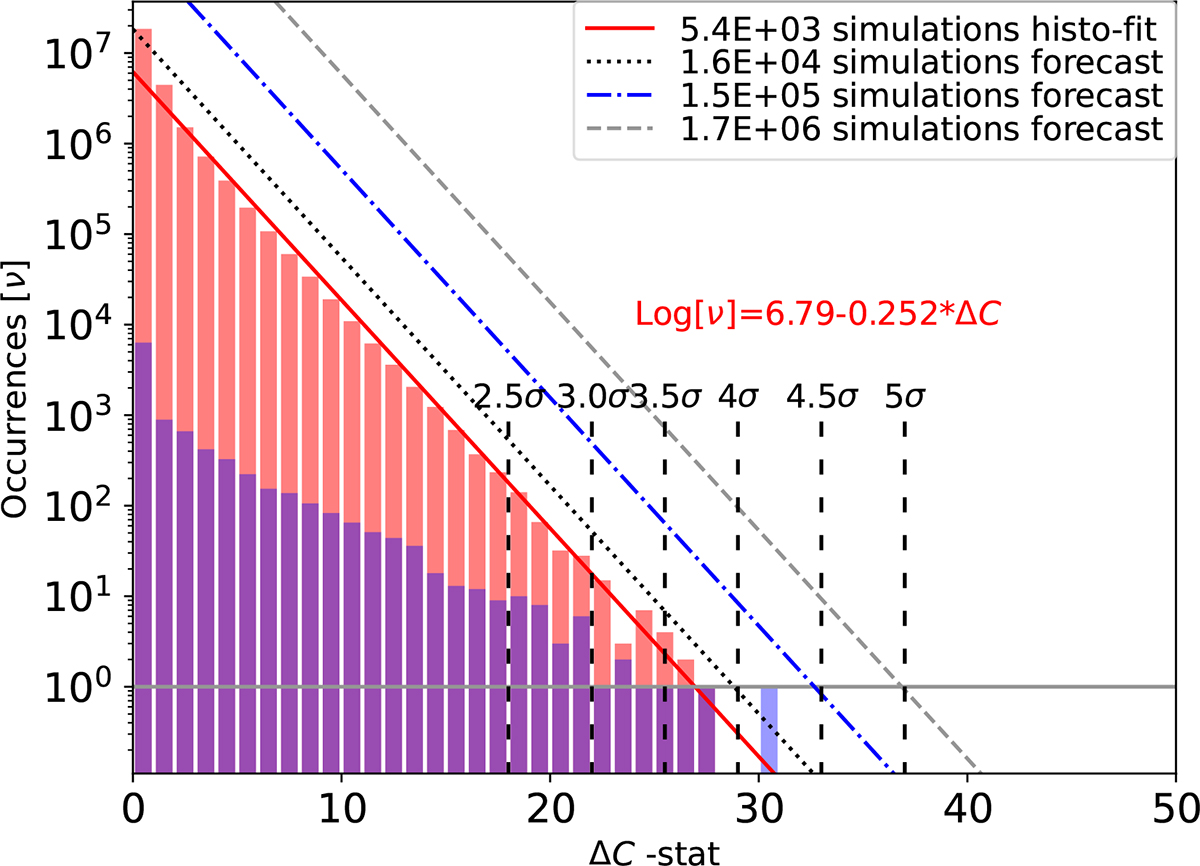
Histogram of ΔC-stat values of a CIE model scan of the time-averaged data adopting a velocity dispersion of 250 km/s (blue bars), and of CIE model scans of 5400 Monte Carlo simulated data (red bars). Forecasts for more simulations are made assuming a constant slope of the histogram, in order to visualise different confidence levels.
Current usage metrics show cumulative count of Article Views (full-text article views including HTML views, PDF and ePub downloads, according to the available data) and Abstracts Views on Vision4Press platform.
Data correspond to usage on the plateform after 2015. The current usage metrics is available 48-96 hours after online publication and is updated daily on week days.
Initial download of the metrics may take a while.