Fig. 4.
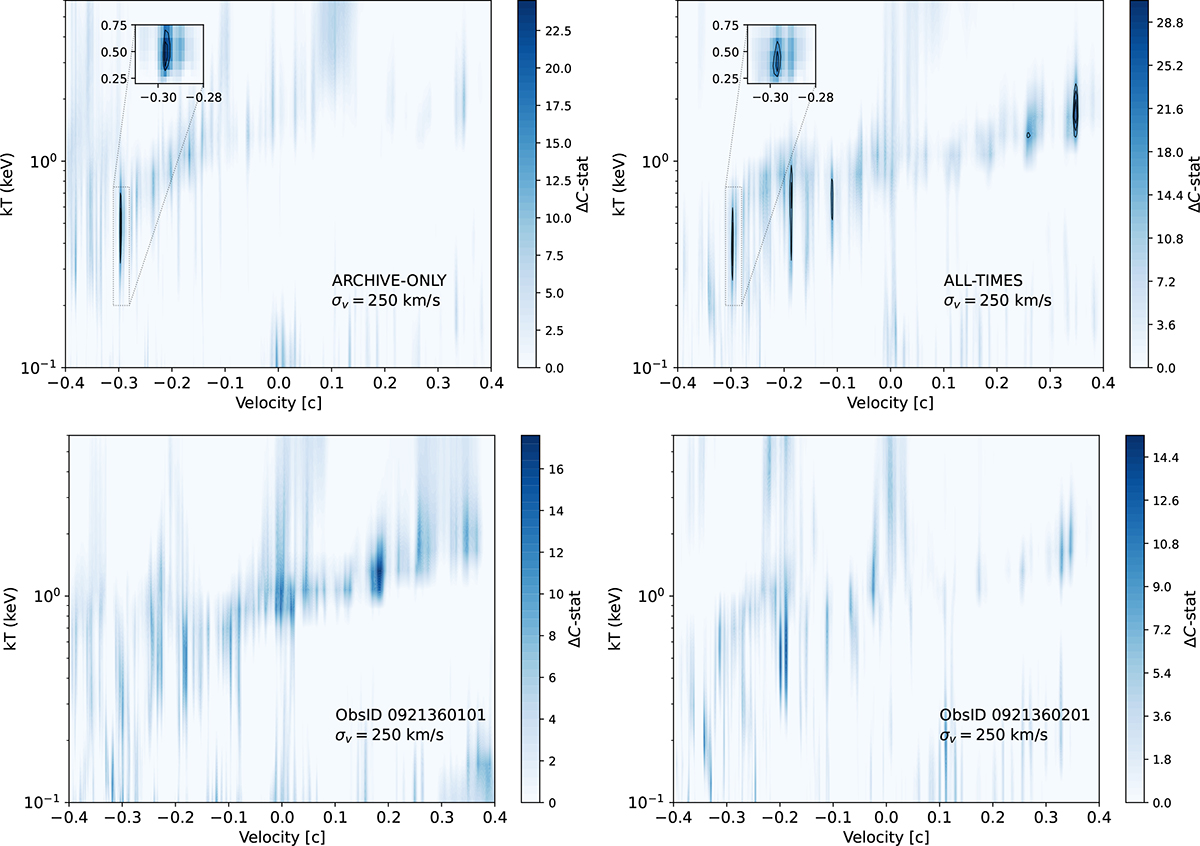
Download original image
CIE model scan performed on the four analysed datasets, adopting a velocity dispersion of 250 km/s. The colours show indication of the ΔC-stat improvement compared to the continuum-only model. The black contours refer to significance levels from 2.5 to 3.5σ with steps of 0.5σ estimated with Monte Carlo simulations (see Section 4.4).
Current usage metrics show cumulative count of Article Views (full-text article views including HTML views, PDF and ePub downloads, according to the available data) and Abstracts Views on Vision4Press platform.
Data correspond to usage on the plateform after 2015. The current usage metrics is available 48-96 hours after online publication and is updated daily on week days.
Initial download of the metrics may take a while.