Fig. 3.
Download original image
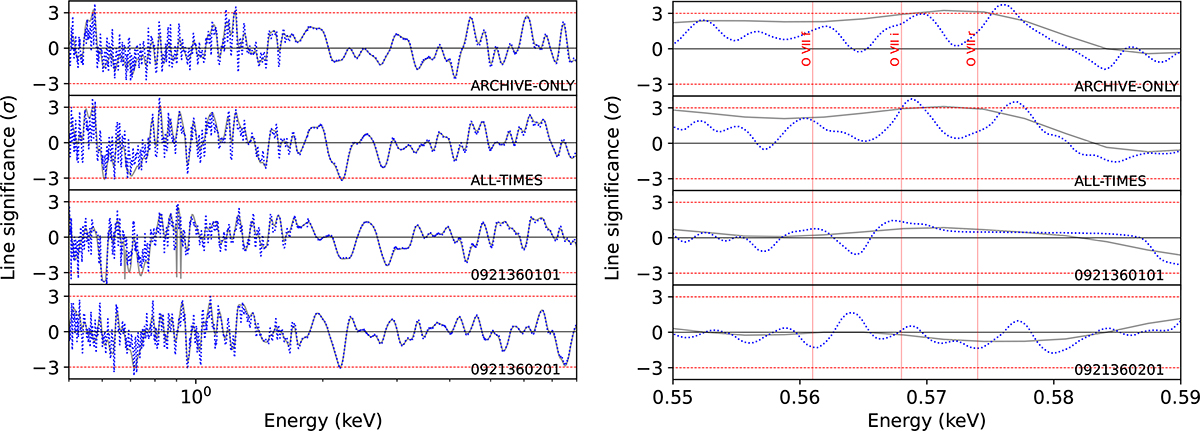
Gaussian line scan performed on the four analysed datasets. We show the results for velocity widths of 2500 km/s (solid grey line) and 100 km/s (dotted blue line). The 3σ threshold (red line) is shown. In the right panel, a zoom in the 0.5 − 0.6 keV energy range is shown to better visualise the O VII line triplet, with the red lines showing the positions of the rest-frame energies.
Current usage metrics show cumulative count of Article Views (full-text article views including HTML views, PDF and ePub downloads, according to the available data) and Abstracts Views on Vision4Press platform.
Data correspond to usage on the plateform after 2015. The current usage metrics is available 48-96 hours after online publication and is updated daily on week days.
Initial download of the metrics may take a while.