Fig. 2.
Download original image
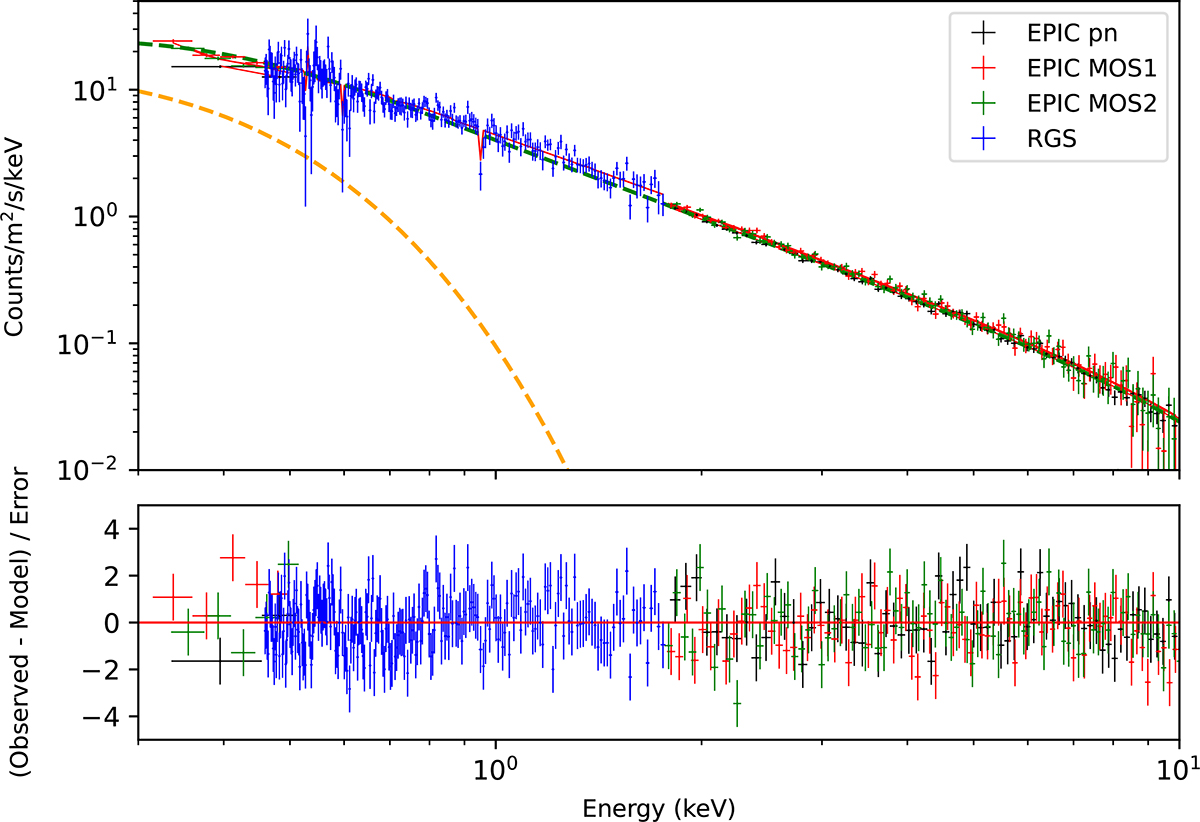
EPIC-pn (black), MOS 1 (red), MOS 2 (green), and RGS (blue) spectra and the best-fit continuum model (red curve), from the stacking of all XMM-Newton observations. The continuum emission components are represented by dashed lines in orange (bb) and green (comt). The EPIC data are ignored in the 0.5 − 1.77 keV energy range to employ the full high spectral resolution of RGS and avoid model degeneracy. The EPIC data are grouped according to the optimal binning and, for a better visualisation, the RGS data are grouped by a factor of 9. The bottom panel shows the residuals of the best-fit model.
Current usage metrics show cumulative count of Article Views (full-text article views including HTML views, PDF and ePub downloads, according to the available data) and Abstracts Views on Vision4Press platform.
Data correspond to usage on the plateform after 2015. The current usage metrics is available 48-96 hours after online publication and is updated daily on week days.
Initial download of the metrics may take a while.