Fig. 10.
Download original image
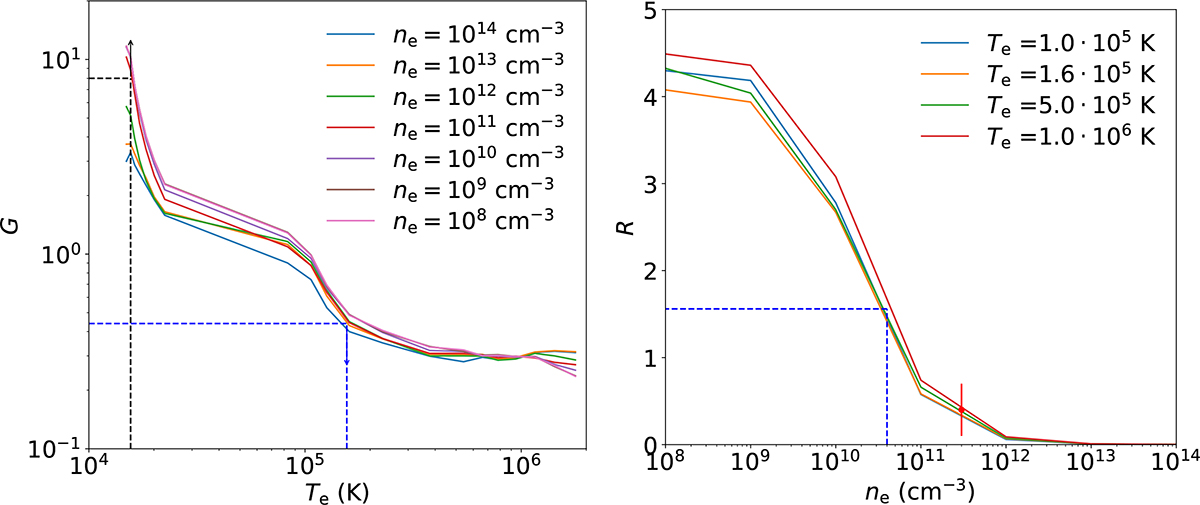
G (left) and R (right) ratios curves for the O VII triplet. Blue arrows show upper and lower limits, corresponding to lower and upper limits on the temperature, respectively. The dashed black lines indicates the results obtained for the rest-frame O VII triplet, while the dashed blue lines for the blueshifted emission lines. In the right panel, the red point indicates the value of R obtained from the rest-frame O VII lines.
Current usage metrics show cumulative count of Article Views (full-text article views including HTML views, PDF and ePub downloads, according to the available data) and Abstracts Views on Vision4Press platform.
Data correspond to usage on the plateform after 2015. The current usage metrics is available 48-96 hours after online publication and is updated daily on week days.
Initial download of the metrics may take a while.