Open Access
Fig. 5.
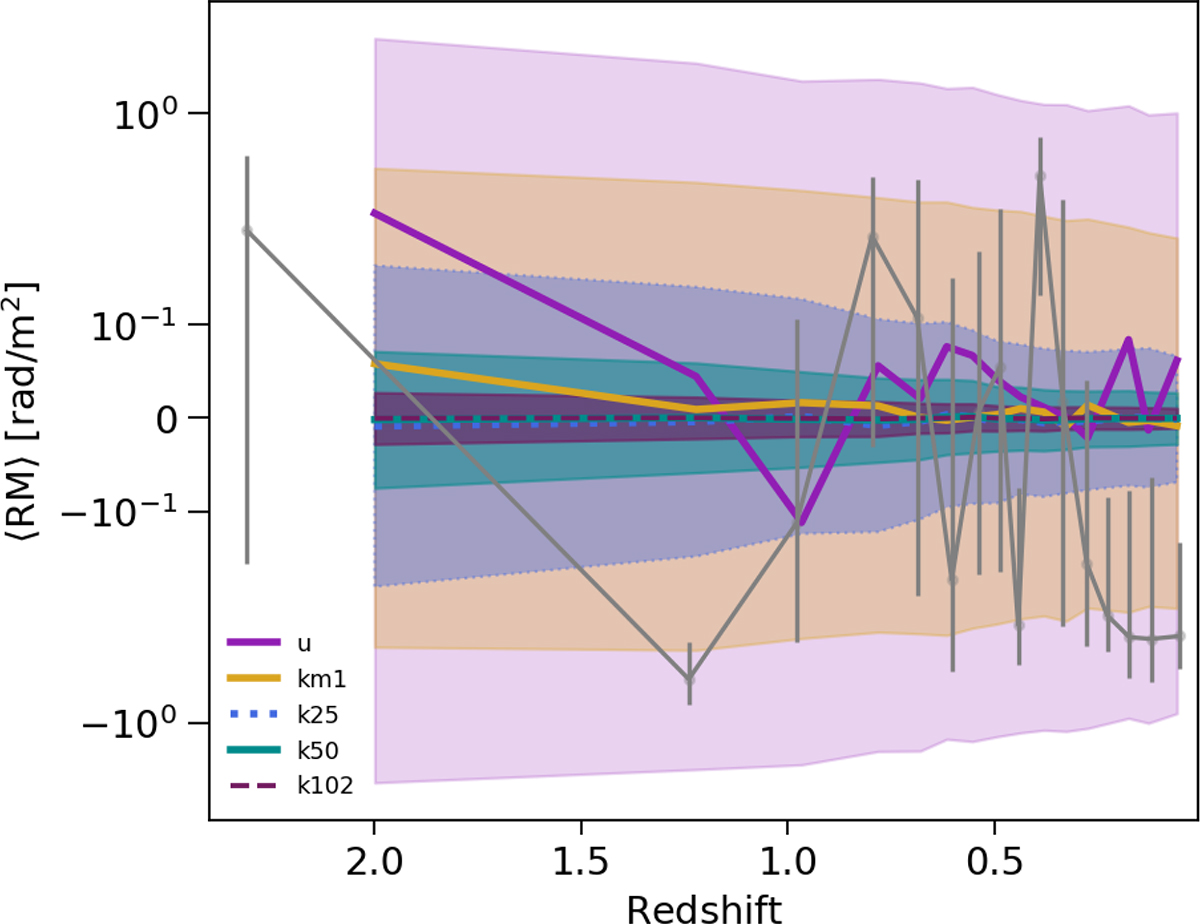
Download original image
Mean RMIGM trends of PMFs and mean RRM from LoTSS data (grey lines); the error for the latter is calculated with bootstrapping, while standard deviations are shown for the simulated RMs (lower-opacity filled colour lines).
Current usage metrics show cumulative count of Article Views (full-text article views including HTML views, PDF and ePub downloads, according to the available data) and Abstracts Views on Vision4Press platform.
Data correspond to usage on the plateform after 2015. The current usage metrics is available 48-96 hours after online publication and is updated daily on week days.
Initial download of the metrics may take a while.