| Issue |
A&A
Volume 696, April 2025
|
|
|---|---|---|
| Article Number | L8 | |
| Number of page(s) | 5 | |
| Section | Letters to the Editor | |
| DOI | https://doi.org/10.1051/0004-6361/202453099 | |
| Published online | 08 April 2025 | |
Letter to the Editor
Intergalactic magnetism in a γ-ray beam as a model of Porphyrion
1
Université Paris Cité, CNRS, Astroparticule et Cosmologie, 75006 Paris, France
2
Laboratory of Astrophysics, École Polytechnique Fédérale de Lausanne, 1015 Lausanne, Switzerland
3
Dipartimento di Fisica e Astronomia, Universita di Bologna, Via Gobetti 93/2, 40129 Bologna, Italy
4
INAF Istituto di Radioastronomia, Via P. Gobetti 101, 40129 Bologna, Italy
5
Nordita, KTH Royal Institute of Technology and Stockholm University, Hannes Alfvéns väg 12, 10691 Stockholm, Sweden
6
The Oskar Klein Centre, Department of Astronomy, Stockholm University, AlbaNova, 10691 Stockholm, Sweden
7
McWilliams Center for Cosmology & Department of Physics, Carnegie Mellon University, Pittsburgh, PA 15213, USA
8
School of Natural Sciences and Medicine, Ilia State University, 3-5 Cholokashvili Avenue, 0194 Tbilisi, Georgia
9
Département de Physique Théorique and Center for Astroparticle Physics, Université de Genève, 1211 Geneve 4, Switzerland
10
Theoretical Physics Department, CERN, 1211 Geneva 23, Switzerland
⋆ Corresponding author.
Received:
20
November
2024
Accepted:
24
March
2025
Abstract
We estimate the magnetic field in the jets of the recently discovered 7 Mpc long Porphyrion system. We used nondetection of the system in gamma-rays to derive a lower bound on the co-moving magnetic field strength at the level of ∼10 nG (comoving). This value is consistent with recent estimates of magnetic fields in the filaments of the large-scale structure. We discuss the possibility that, instead of being the extreme case of a radio jet formation scenario, Porphyrion actually traces a very high-energy γ-ray beam emitted by an active galactic nucleus. In such a model, jets do not need to spread into the voids of the large-scale structure to appear straight on a very large distance range, and several anomalies of the standard radio jet scenarios can be solved at once.
Key words: magnetic fields / galaxies: active / galaxies: jets / large-scale structure of Universe / gamma rays: galaxies / radio lines: galaxies
© The Authors 2025
 Open Access article, published by EDP Sciences, under the terms of the Creative Commons Attribution License (https://creativecommons.org/licenses/by/4.0), which permits unrestricted use, distribution, and reproduction in any medium, provided the original work is properly cited.
This article is published in open access under the Subscribe to Open model. This email address is being protected from spambots. You need JavaScript enabled to view it. to support open access publication.
1. Introduction
Outflows from active galactic nuclei (AGNs) may spread high-energy particles and magnetic fields over very large, megaparsec-scale volumes in the intergalactic medium (IGM). The recent discovery of the 7 Mpc scale jet structure of the Porphyrion galaxy (Oei et al. 2024) at redshift z ≃ 0.9 shows that the sizes of such outflows may reach a significant fraction of the size of the voids of the large-scale structure (LSS). If such jets penetrate into the voids, they may transport magnetic fields as well as relativistic particles into the voids.
Void magnetic fields may be measured using the technique of γ-ray astronomy through the effect of secondary γ-ray emission from electron-positron pairs deposited in the voids by very high-energy γ-rays (Neronov & Semikoz 2009). Observations with current generation γ-ray telescopes impose a lower bound on the void magnetic fields at the level of 10−17–3 × 10⁻¹⁴ G (Acciari et al. 2023; Neronov & Vovk 2010; Aharonian et al. 2023), depending on the assumptions on the duty cycle of the parent source of γ-rays. The void magnetic fields may be of cosmological origin (Durrer & Neronov 2013), and in this case the measurement of their properties would provide a useful cosmological probe. While the general consensus from simulations is that the collective activity of galaxies alone cannot magnetize voids to the level implied by the γ-ray lower bound (e.g., Bondarenko et al. 2022; Tjemsland et al. 2024), the magnetic fields spread by radio galaxies such as Porphyrion may pollute the voids and prevent measurement of the relic voids fields there.
The Porphyrion jets have a number of remarkable properties. They remain collimated over at least ≈ 3.5 Mpc on both sides of the parent AGN. This is puzzling (Oei et al. 2024) because one generically expects development of magnetohydrodynamical (MHD) instabilities in the directed relativistic plasma flow, either intrinsic or induced by the prolonged entrainment of gas from the surrounding IGM. Straightness of the jet also implies a low velocity of the parent AGN and the absence of variations of the orientation of the axis of the supermassive black hole in its core over a prolonged period of its activity of ∼ 2 Gyr. Modeling of such a remarkably stable jet (Oei et al. 2024) suggests that the AGN should have been working at nearly the Eddington limit during this entire time.
In what follows we propose an alternative explanation for the formation of Porphyrion (also applicable to other similar objects) and we argue that the Porphyrion jets do not necessarily need to spread into the voids to keep their direction stable over a very large distance. We discuss the possibility that the observed structure is a jet-like feature produced by a beam of very high-energy γ-rays producing electron-positron pairs in the IGM. These γ-ray beam traces do not need to transport charged particle plasma from the AGN nucleus nor do they need to sustain their own magnetic fields.
2. Inverse-Compton emission from Porphyrion
The synchrotron radio emission from the Porphyrion jets is produced mostly by electrons with energies Ee that can be inferred from the frequency of the synchrotron radiation,
![Mathematical equation: $$ \begin{aligned} \nu _{\rm s}\simeq 100\left[\frac{B}{10\,\mathrm{nG}}\right]\left[\frac{E_{\rm e}}{30\,\mathrm{GeV}}\right]^2\,\mathrm{MHz}, \end{aligned} $$](/articles/aa/full_html/2025/04/aa53099-24/aa53099-24-eq1.gif) (1)
(1)
if the magnetic field B in the emission region is known. For example, if the field is at the level of the fields found in the filaments of the LSS, B ∼ 10 nG (Carretti et al. 2022), the synchrotron-emitting electrons have energies in the 10–100 GeV range.
The same electrons also produce inverse-Compton scattered photons from the CMB photons at the source redshift with energies (Neronov & Semikoz 2009)
![Mathematical equation: $$ \begin{aligned} E_{\gamma }\simeq 6\left[\frac{E_{\rm e}}{30\,\mathrm{GeV}}\right]^2\,\mathrm{MeV}. \end{aligned} $$](/articles/aa/full_html/2025/04/aa53099-24/aa53099-24-eq2.gif) (2)
(2)
The ratio of the inverse-Compton to synchrotron fluxes from the jet, FIC to Fs, is determined by the ratio of the energy densities of the CMB and the magnetic field
![Mathematical equation: $$ \begin{aligned} \frac{F_\mathrm{IC} }{F_{\rm s}}=\frac{U_\mathrm{CMB} }{U_B}\simeq 10^6\left[\frac{B}{10\,\mathrm{nG}}\right]^{-2} \end{aligned} $$](/articles/aa/full_html/2025/04/aa53099-24/aa53099-24-eq3.gif) (3)
(3)
at redshift z ≃ 0.9, where the energy density of the CMB is increased by a factor of (1 + z)4 ≃ 13 compared to the local Universe.
The synchrotron flux of Porphyrion is at the level Fs ∼ 10−16 erg cm−2 s−1. This suggests that the γ-ray flux may be as high as FIC ∼ 10−10 erg cm−2 s−1 in E ∼ 10 MeV band, yielding a very bright γ-ray source. Such a flux is potentially detectable with the Fermi Large Area Telescope (LAT) (Atwood et al. 2009), which has an energy threshold in the Ethr, LAT ∼ 50 MeV range.
3. Upper bound on the γ-ray flux of the jet
We used Fermi/LAT data publicly available through the Fermi Science Support Center1 to measure the flux of Porphyrion or to derive an upper limit on it. We considered γ-ray events with energies between 50 MeV and 100 GeV within 15° of the source collected between 2008 and 2024. We filtered the events of P8R3_SOURCEVETO_V3 type using the gtselect-gtmktime tool chain to retain only the highest quality events most likely expected to be γ-rays.
Figure 1 shows the countmaps of the Porphyrion region in Fermi/LAT in the energy ranges 50–100 MeV and 100 MeV–1 GeV. As there is no excess in the direction of the source, we derive an upper limit on the source flux in logarithmically spaced energy bins, using the aperture photometry method. We extracted the photon counts from circles of the radius 2° (1°) in the energy bins below (above) 1 GeV. We define the 95% upper bound on the source flux as  , where N is the number of counts in the source circle. Then, we estimated the exposure corrected for the fraction of the source flux contained within the fixed radius, using the gtexposure tool. The resulting upper limit on the source flux is shown by the thick gray curve in Fig. 2.
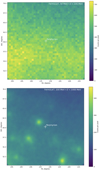 |
Fig. 1. Fermi/LAT countmaps of the region around Porphyrion in the energy ranges 50 MeV < Eγ < 100 MeV (top) and 100 MeV < Eγ < 1000 MeV (bottom). The size of the Porphyrion source is smaller than the size of the cross at the source position. The brighter spots in the lower image are sources other than Porphyrion detected by Fermi/LAT. |
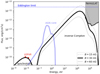 |
Fig. 2. Spectral energy distribution of Porphyrion modeled as synchrotron and inverse-Compton emission. The black data points show the radio flux of the jet. The gray-shaded region shows an upper limit on γ-ray flux from Fermi/LAT. The light blue curve shows the host AGN spectral energy distribution model from Oei et al. (2024). The dashed horizontal line shows the level of flux expected from a source powered by a 109 M⊙ black hole emitting at Eddington limit. The red, blue, and green points show the expected inverse-Compton flux level from electrons emitting synchrotron radiation in the LOFAR frequency range, for different proper magnetic field levels. |
To find an upper bound on the magnetic field, we modeled synchrotron and inverse-Compton emission from a cutoff power-law distribution of electrons:
 (4)
(4)
The seed photons for the inverse-Compton scattering are provided by the CMB and the extragalactic background light (EBL, Gilmore et al. 2012; Franceschini & Rodighiero 2017) at the redshift of the source. The resulting model is shown by the black solid line in Fig. 2 for the minimal possible magnetic field strength,
 (5)
(5)
as well as for the fields with the strength 15 nG and 60 nG. The high-energy cutoff in the electron spectrum is Ecut = 40 GeV for the 15 nG field model and it is lower for the 30 nG and 60 nG models by factors of  and 2, respectively, so that the synchrotron spectrum always peaks at the same energy. If the magnetic field were below this bound, the inverse-Compton flux would be observable in Fermi/LAT because the inverse-Compton component of the source spectrum (the right bump of the model curve) would move in the upper-right direction and exceed the Fermi/LAT upper bound.
4. Comparison with magnetic fields in the filaments of the LSS
The comoving minimal field strength,
 (6)
(6)
is close to the global estimate of the magnetic field in the filaments of the LSS (e.g., Carretti et al. 2022; Mtchedlidze et al. 2024; Carretti et al. 2025). If the jets of Porphyrion are occasionally aligned along the filament direction, the field present in the synchrotron emission region may well be the background magnetic field in the LSS rather than the field transported by the jet plasma.
To more closely compare with the geometry of Porphyrion, we extracted from a large cosmological simulation at z = 1 (e.g., Vazza et al. 2019) several one-dimensional slices of magnetic fields starting from small-mass halos within approximately straight filaments, and out to a distance of ≈ 3.5 Mpc from the halo to reproduce the separation between the core and the outer lobes of Porphyrion. The simulation used a simple initially uniform primordial magnetic field seed of 0.1 nG (comoving) inserted at the start of the simulation (z = 50) and evolved under ideal MHD conditions with dark and baryonic matter in the ENZO code. This simple model was shown to produce a very good match to the properties of stacked polarized radio emission from the cosmic web in the recent observations by Vernstrom et al. (2023).
The general finding is that all paths have Bcomoving ∼ 10–15 nG magnetic fields for a large fraction of Porphyrion’s projected extension, with frequent fluctuations of order ×2 in magnetic field strength over scales of ∼ 102 kpc, corresponding to the typical size of substructures in filaments (Fig. 3).
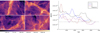 |
Fig. 3. Left panels: Mass-weighted mean comoving magnetic field strength for four different filaments in a cosmological simulation at z = 1. Right panels: Corresponding profiles of comoving magnetic field strength through the same filaments, for a total extent compatible with the longest jet of Porphyrion. |
This suggests that the jet may be contained within a filament of the LSS. The alignment of the jet with the filament direction need not be strong. The typical radius of a filament is rf ∼ 1.5–2 Mpc (Colberg et al. 2005), so that only a mild alignment, by an angle Θ ∼ arcsin(rf/Rj)≃30° along the filament is needed for a jet of length Rj ≃ 3.5 Mpc to be contained in a filament. Considering that longer jets require a better large-scale alignment with surrounding filaments to produce detectable radio emission in this scenario, this might qualitatively explain why this phenomenon is relatively rare to observe. A quantitative exploration of the statistics of such a configuration with full cosmological simulations is deferred to future work.
5. Gamma-ray beam model of the system
Observations with γ-ray telescopes have revealed a population called TeV blazars, AGNs that emit narrow beams of γ-rays with energies in excess of 10 TeV (Biteau et al. 2020). Alignment along the line of sight leads to strong Doppler boosting of γ-ray emission in blazars and facilitates their observations in the γ-ray band. In the absence of alignment, the γ-ray beam may not be detectable by γ-ray telescopes, but it should leave a trace in the IGM that is observable at lower energies (Neronov et al. 2002). The trace is produced by synchrotron and inverse-Compton emission by electrons and positrons deposited along the beam by the effect of pair production of γ-rays interacting with the visible/infrared EBL (Gould & Schréder 1967). The mean free path of the γ-rays with energies Eγ0 through the EBL at the redshift z ∼ 1 (Fitoussi et al. 2017),
 (7)
(7)
is comparable to the length scale of Porphyrion-type beams for Eγ0 ≳ 10 TeV. This means that all the energy of the γ-ray beam is converted into the energy of electrons and positrons deposited nearly homogeneously in the IGM on a distance scale of several megaparsecs.
The electrons and positrons are initially injected in the energy range Ee ∼ (0.1–1)Eγ0. Once injected, these electrons and positrons cool via inverse-Compton scattering on the cosmic microwave background (CMB) at z ≃ 1 on the timescale
![Mathematical equation: $$ \begin{aligned} t_\mathrm{cool} \simeq 1.5\left[\frac{E_{\rm e}}{30\,\mathrm{GeV}}\right]^{-1}\,\mathrm{Myr} \end{aligned} $$](/articles/aa/full_html/2025/04/aa53099-24/aa53099-24-eq10.gif) (8)
(8)
that becomes comparable to the light-crossing time of Porphyrion, which is tlc ≃ 10 Myr for electrons with energies in the GeV energy range. This leads to the formation of a low-energy tail of the electron-positron distribution.
In our model, ∼TeV electrons and positrons are injected by the pair creation process (with a hard spectrum, α ≪ 2, dN/dE ∝ E−α), and cool down to a dN/dE ∝ E−2 spectrum (from TeV down to MeV) while the source is turned on (cooling down to the MeV scale would require the source to be turned on over a gigayear timescale; see Neronov et al. 2002). It should be noted that, in order for a dN/dE ∝ E−2 spectrum to be achieved, the source would need to have a constant luminosity over the injection time period; a more complex luminosity history would imprint itself on the resultant spectrum. In the recent past (∼10 Myr) the source has turned off, leading to a hard cutoff forming in the dN/dE ∝ E−2 electron spectrum above GeV energies. The spectrum of inverse-Compton emission from an E−2 distribution of electrons has the slope dNγ/dE ∝ E−1.5 and the inverse-Compton emission from TeV electrons is expected to be in the 10–100 GeV range. Nondetection of this emission by Fermi/LAT suggests that the AGN core luminosity in very high-energy γ-rays should have been decreasing over the last few million years so that only electrons and positrons that cooled down are surviving. Otherwise, if the magnetic field in the jet is an order of magnitude stronger than the lower bound derived above, the level of the inverse-Compton flux would be below the Fermi/LAT upper bound, even if the source of the TeV γ-rays remained active until now. In any case, the population of cooled electrons and positrons that remains along the trace of the γ-ray beam over t ≳ 10 Myr is expected to produce a radio synchrotron glow along the path of the γ-ray beam. It is thus very possible that the straight jet of Porphyrion is a trace of a very high-energy γ-ray beam emitted by the AGN core in the past (≤10–15 Myr ago).
6. Discussion
The stability of jets in the relativistic regime has been thoroughly studied with analytical and numerical approaches to explore the role of jet parameters (bulk Lorentz factor, composition, density, temperature) and environment (e.g., Blandford et al. 2019; Komissarov & Porth 2021; Perucho & López-Miralles 2023, for recent reviews). A general finding is that the most important instabilities that can disrupt or de-collimate jets (e.g., Kelvin-Helmholtz modes) grow more quickly in slower and hotter flows than in cold and fast ones. Faster jets with a high bulk Lorentz factor Γ develop short-wavelength and high-order modes that get amplified in the shear layer and eventually saturate the growth of the instabilities, without loss of collimation, and generating a hot shear layer around the core of the jet (Perucho et al. 2022). Based on this, in order to explain the very high degree of stability of Porphyrion, one needs to assume a very relativistic jet (Γ ∼ 2) traveling as a bullet in an extremely low-density environment. It is, however, not clear if this picture, developed to interpret the jet stability on ≤ 102 kpc scales, would hold up to megaparsec-scale distances. There are currently no available numerical or semi-analytical models that can test the validity of this scenario on the much longer timescales and spatial scales implied by Porphyrion. At the same time, several more objects with similar characteristics but slightly smaller overall extension were already detected by recent LOFAR surveys (e.g., Oei et al. 2023; Simonte et al. 2024).
This context makes it interesting to explore our radically different interpretation, which bypasses the anomalies that Porphyrion poses to our understanding of radio jets. Figure 4 gives a schematic view of the most important differences implied by the two models of Porphyrion discussed in this work. The γ-ray beam trace model considered above provides such an alternative interpretation. Contrary to the conventional jet models, the problem of directional stability does not even exist in the γ-ray beam trace model. γ-rays are generically expected to deposit electrons and positrons along a straight line of a length comparable to the γ-ray mean free path. Thus, straight megaparsec-scale line-like features such as Porphyrion are good candidates for being tracers of γ-ray beams from their parent AGN.
 |
Fig. 4. Cartoon views of the two physical models for Porphyrion discussed in this work. vh in the left plot denotes the putative hot-spot terminal velocity, while vb in the right plot denotes the beam velocity. |
In principle, straight jet-like features that are electron-positron pair traces of γ-ray beams should be present in all AGNs that emit TeV γ-rays. It is also likely that the γ-ray beams in these AGNs are ejected in the direction of the black hole spin axis, in which case they are expected to be aligned along the directions of the AGN jets. TeV γ-rays can also be produced by high-energy particles accelerated in the jets. A TeV γ-ray beam propagating through the jet may simply provide an additional source of high-energy electrons and positrons in the jet. It is not obvious how to distinguish this source from other possible sources of high-energy particles in the jets, such as shock acceleration in the jet knots.
According to the model for Porphyrion given in Oei et al. (2024), the jet had an average power of P ∼ 1046 erg s−1 active for τ ∼ 1.9 Gyr, and the total deposited energy is ∼8 ⋅ 1062 erg in the jets. This implies a total accreted mass of ΔM ∼ 109 M⊙, which makes the association of Porphyrion with the quasar in the region (total mass Mq ∼ 2 ⋅ 108 M⊙) impossible.
In the γ-ray beam model, E ∼ 300 GeV electrons emitting synchrotron radiation at 100 MHz (the latter being energetically negligible) were initially injected with E ∼ TeV energy by a γ-ray beam. The injection should have lasted at least ∼10 Myr (the time needed for γ-rays to propagate over the jet length). The present-day luminosity of Porphyrion in the γ-ray band (Fig. 2) is of ≲5 × 1045 erg/s (depending on the unknown magnetic field strength in the jet). This suggests an energy output of ≲1060 erg on a 10 Myr timescale. The energy injected by the γ-ray beam must have been ∼ 1 TeV/30 GeV ∼ 33 times larger in the past, because by now each electron injected by the γ-ray interactions has lost most of its energy (∼97%). Thus, the total energy of the γ-ray beam should have been ≲ 3 · 1061 erg. We can thus estimate an overall ≳30 times lower energy budget to explain Porphyrion according to the γ-ray beam scenario, compared to the conventional radio jet model.
Our study of the nondetection of inverse-Compton emission from Porphyrion in γ-rays yields a lower bound on the magnetic field in the jet. This constraint can be further improved via a search of inverse-Compton flux at lower energies, as is clear from Fig. 2. GeV energy electrons are generically expected to be present in the jet because of their relatively long cooling timescale (see Eq. (8). These electrons produce inverse-Compton emission in the hard X-ray energy range (see Eq. (2)). The E ∼ 100 keV inverse-Compton emission from these electrons is unfortunately beyond the reach of existing and planned telescopes in this energy range. If the activity timescale of the γ-ray beam from the parent AGN is in the ≳100 Myr range, the cooling of electrons to sub-GeV energies may result in inverse-Compton emission in the X-ray range where the sensitivity of existing telescopes may be sufficient for its detection.
7. Conclusion
To summarize, our proposed γ-ray model for Porphyrion presents the following advantages: (a) it naturally explains the straightness of the jet on such large scales, (b) it makes no critical requirements on the jet’s internal physical parameters, (c) it lowers the energy requirements for the central AGN, and (d) it does not require jet propagation in the very low-density environment of the LSS voids. The model can be observationally tested with future hard X-ray observations, and through the statistical comparison of larger datasets of Porphyrion-like systems in future radio surveys.
Acknowledgments
We acknowledge fruitful scientific discussion with M. Brüggen, M. Perucho, M. Oei, H. Rottgering and S. Mtchedlidze. F.V. acknowledges CINECA, under the award “IsB28_RADGALEO” under the ISCRA initiative, for the availability of high-performance computing resources and support, and Fondazione Cariplo and Fondazione CDP, for grant no. Rif: 2022-2088 CUP J33C22004310003 for “BREAKTHRU” project. A.B. acknowledges support by the Swedish Research Council (Vetenskapsrådet, 2019-04234).
References
- Acciari, V. A., Agudo, I., Aniello, T., et al. 2023, A&A, 670, A145 [NASA ADS] [CrossRef] [EDP Sciences] [Google Scholar]
- Aharonian, F., Aschersleben, J., Backes, M., et al. 2023, ApJ, 950, L16 [NASA ADS] [CrossRef] [Google Scholar]
- Atwood, W. B., Abdo, A. A., Ackermann, M., et al. 2009, ApJ, 697, 1071 [CrossRef] [Google Scholar]
- Biteau, J., Prandini, E., Costamante, L., et al. 2020, NatAs, 4, 124 [Google Scholar]
- Blandford, R., Meier, D., & Readhead, A. 2019, ARA&A, 57, 467 [NASA ADS] [CrossRef] [Google Scholar]
- Bondarenko, K., Boyarsky, A., Korochkin, A., et al. 2022, A&A, 660, A80 [NASA ADS] [CrossRef] [EDP Sciences] [Google Scholar]
- Carretti, E., O’Sullivan, S. P., Vacca, V., et al. 2022, MNRAS, 518, 2273 [NASA ADS] [CrossRef] [Google Scholar]
- Carretti, E., Vazza, F., O’Sullivan, S. P., et al. 2025, A&A, 693, A208 [NASA ADS] [CrossRef] [EDP Sciences] [Google Scholar]
- Colberg, J. M., Krughoff, K. S., & Connolly, A. J. 2005, MNRAS, 359, 272 [NASA ADS] [CrossRef] [Google Scholar]
- Durrer, R., & Neronov, A. 2013, A&AR, 21, 62 [NASA ADS] [CrossRef] [Google Scholar]
- Fitoussi, T., Belmont, R., Malzac, J., et al. 2017, MNRAS, 466, 3472 [CrossRef] [Google Scholar]
- Franceschini, A., & Rodighiero, G. 2017, A&A, 603, A34 [NASA ADS] [CrossRef] [EDP Sciences] [Google Scholar]
- Gilmore, R. C., Somerville, R. S., Primack, J. R., & Domínguez, A. 2012, MNRAS, 422, 3189 [NASA ADS] [CrossRef] [Google Scholar]
- Gould, R. J., & Schréder, G. P. 1967, PhRv, 155, 1404 [Google Scholar]
- Komissarov, S., & Porth, O. 2021, NewAR, 92, 101610 [Google Scholar]
- Mtchedlidze, S., Domínguez-Fernández, P., Du, X., et al. 2024, ApJ, 977, 128 [NASA ADS] [Google Scholar]
- Neronov, A., & Semikoz, D. V. 2009, PhRvD, 80, 123012 [Google Scholar]
- Neronov, A., & Vovk, I. 2010, Science, 328, 73 [NASA ADS] [CrossRef] [Google Scholar]
- Neronov, A., Semikoz, D., Aharonian, F., & Kalashev, O. 2002, PhRvL, 89 [Google Scholar]
- Oei, M. S. S. L., van Weeren, R. J., Gast, A. R. D. J. G. I. B., et al. 2023, A&A, 672, A163 [NASA ADS] [CrossRef] [EDP Sciences] [Google Scholar]
- Oei, M., Hardcastle, M., Timmerman, R., et al. 2024, Nature, 633, 537 [NASA ADS] [CrossRef] [Google Scholar]
- Perucho, M., & López-Miralles, J. 2023, JPlPh, 89, 915890501 [NASA ADS] [Google Scholar]
- Perucho, M., Martí, J.-M., & Quilis, V. 2022, MNRAS, 510, 2084 [Google Scholar]
- Simonte, M., Andernach, H., Brüggen, M., Miley, G. K., & Barthel, P. 2024, A&A, 686, A21 [NASA ADS] [CrossRef] [EDP Sciences] [Google Scholar]
- Tjemsland, J., Meyer, M., & Vazza, F. 2024, ApJ, 963, 135 [NASA ADS] [CrossRef] [Google Scholar]
- Vazza, F., Ettori, S., Roncarelli, M., et al. 2019, A&A, 627, A5 [NASA ADS] [CrossRef] [EDP Sciences] [Google Scholar]
- Vernstrom, T., West, J., Vazza, F., et al. 2023, SciA, 9, eade7233 [Google Scholar]
All Figures
|
Fig. 1. Fermi/LAT countmaps of the region around Porphyrion in the energy ranges 50 MeV < Eγ < 100 MeV (top) and 100 MeV < Eγ < 1000 MeV (bottom). The size of the Porphyrion source is smaller than the size of the cross at the source position. The brighter spots in the lower image are sources other than Porphyrion detected by Fermi/LAT. |
| In the text | |
|
Fig. 2. Spectral energy distribution of Porphyrion modeled as synchrotron and inverse-Compton emission. The black data points show the radio flux of the jet. The gray-shaded region shows an upper limit on γ-ray flux from Fermi/LAT. The light blue curve shows the host AGN spectral energy distribution model from Oei et al. (2024). The dashed horizontal line shows the level of flux expected from a source powered by a 109 M⊙ black hole emitting at Eddington limit. The red, blue, and green points show the expected inverse-Compton flux level from electrons emitting synchrotron radiation in the LOFAR frequency range, for different proper magnetic field levels. |
| In the text | |
|
Fig. 3. Left panels: Mass-weighted mean comoving magnetic field strength for four different filaments in a cosmological simulation at z = 1. Right panels: Corresponding profiles of comoving magnetic field strength through the same filaments, for a total extent compatible with the longest jet of Porphyrion. |
| In the text | |
|
Fig. 4. Cartoon views of the two physical models for Porphyrion discussed in this work. vh in the left plot denotes the putative hot-spot terminal velocity, while vb in the right plot denotes the beam velocity. |
| In the text | |
Current usage metrics show cumulative count of Article Views (full-text article views including HTML views, PDF and ePub downloads, according to the available data) and Abstracts Views on Vision4Press platform.
Data correspond to usage on the plateform after 2015. The current usage metrics is available 48-96 hours after online publication and is updated daily on week days.
Initial download of the metrics may take a while.