Fig. 2.
Download original image
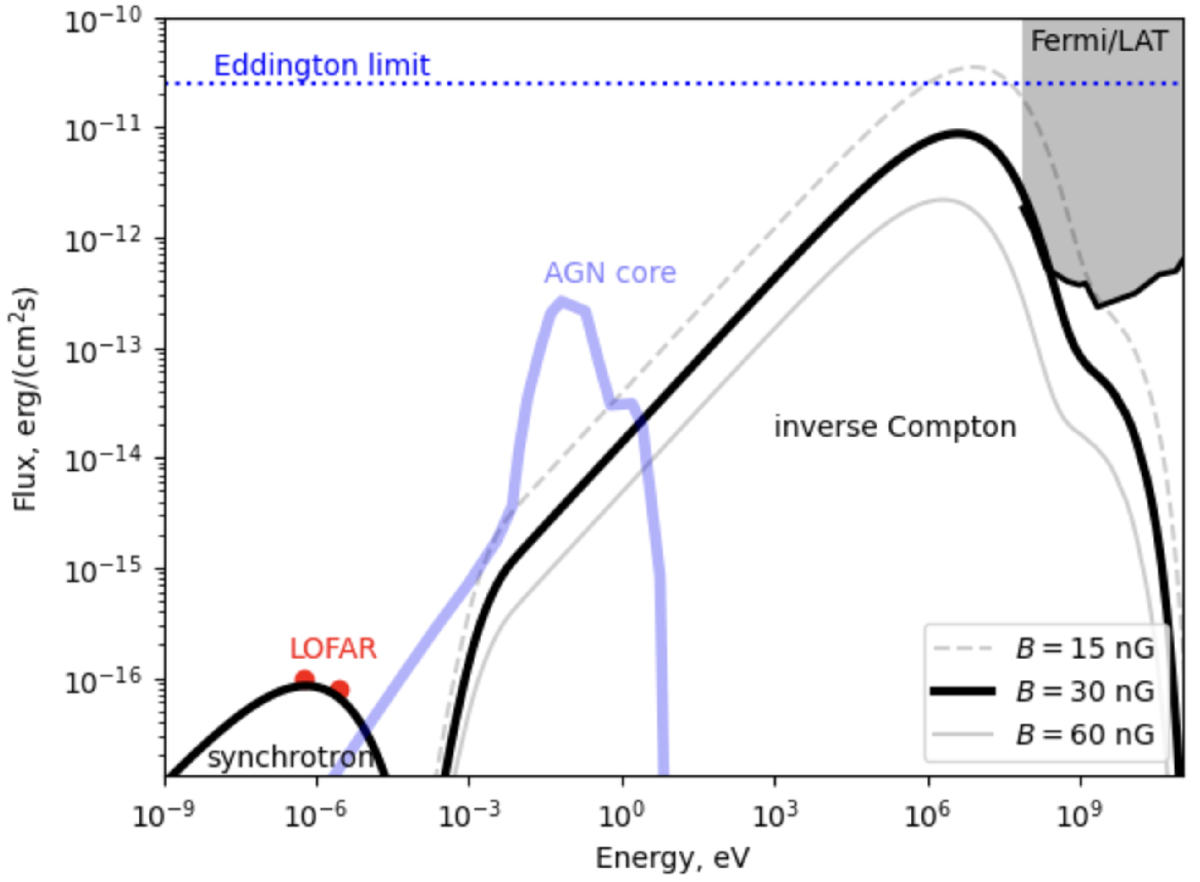
Spectral energy distribution of Porphyrion modeled as synchrotron and inverse-Compton emission. The black data points show the radio flux of the jet. The gray-shaded region shows an upper limit on γ-ray flux from Fermi/LAT. The light blue curve shows the host AGN spectral energy distribution model from Oei et al. (2024). The dashed horizontal line shows the level of flux expected from a source powered by a 109 M⊙ black hole emitting at Eddington limit. The red, blue, and green points show the expected inverse-Compton flux level from electrons emitting synchrotron radiation in the LOFAR frequency range, for different proper magnetic field levels.
Current usage metrics show cumulative count of Article Views (full-text article views including HTML views, PDF and ePub downloads, according to the available data) and Abstracts Views on Vision4Press platform.
Data correspond to usage on the plateform after 2015. The current usage metrics is available 48-96 hours after online publication and is updated daily on week days.
Initial download of the metrics may take a while.