Fig. 1.
Download original image
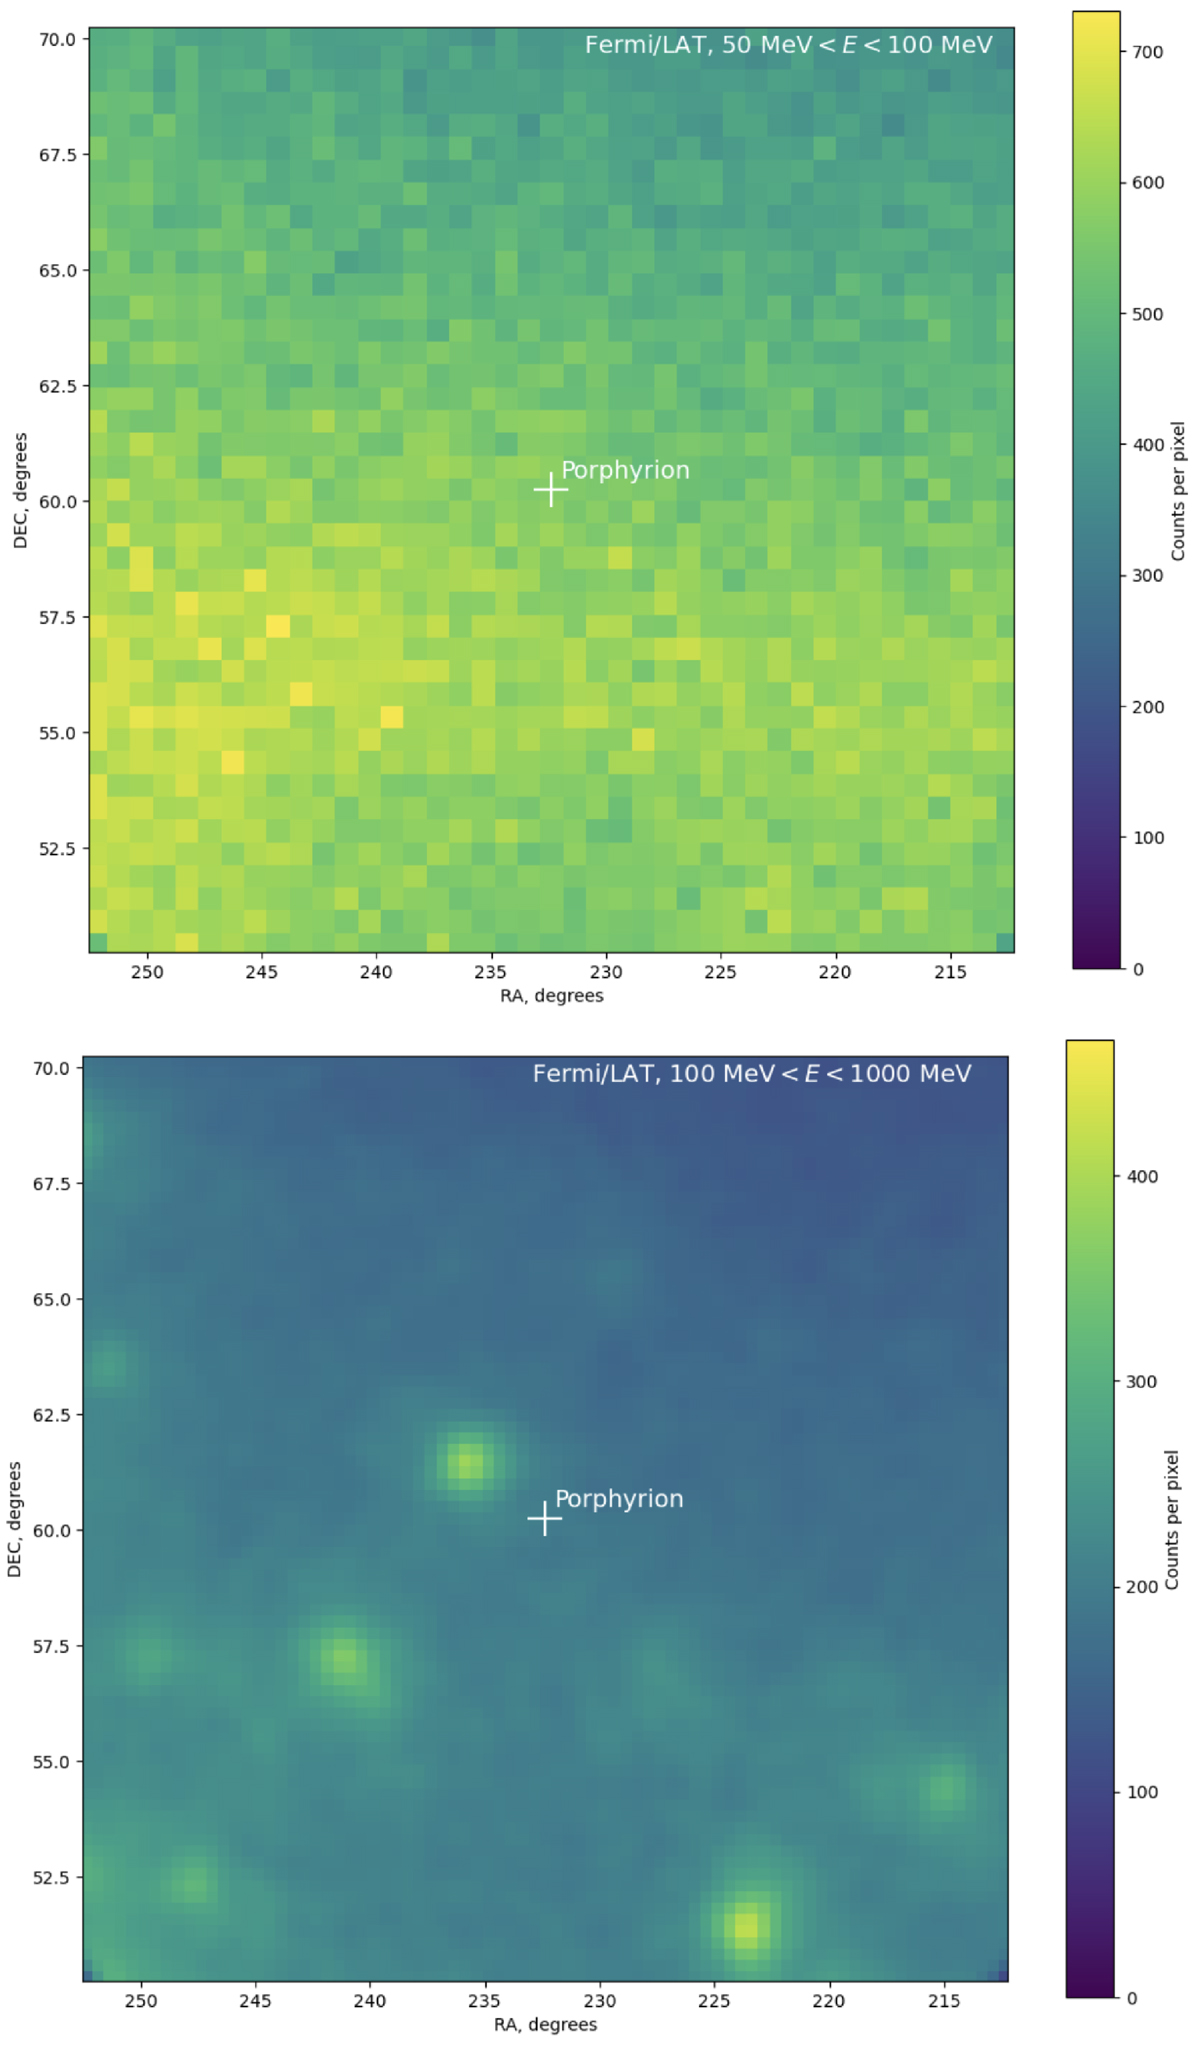
Fermi/LAT countmaps of the region around Porphyrion in the energy ranges 50 MeV < Eγ < 100 MeV (top) and 100 MeV < Eγ < 1000 MeV (bottom). The size of the Porphyrion source is smaller than the size of the cross at the source position. The brighter spots in the lower image are sources other than Porphyrion detected by Fermi/LAT.
Current usage metrics show cumulative count of Article Views (full-text article views including HTML views, PDF and ePub downloads, according to the available data) and Abstracts Views on Vision4Press platform.
Data correspond to usage on the plateform after 2015. The current usage metrics is available 48-96 hours after online publication and is updated daily on week days.
Initial download of the metrics may take a while.