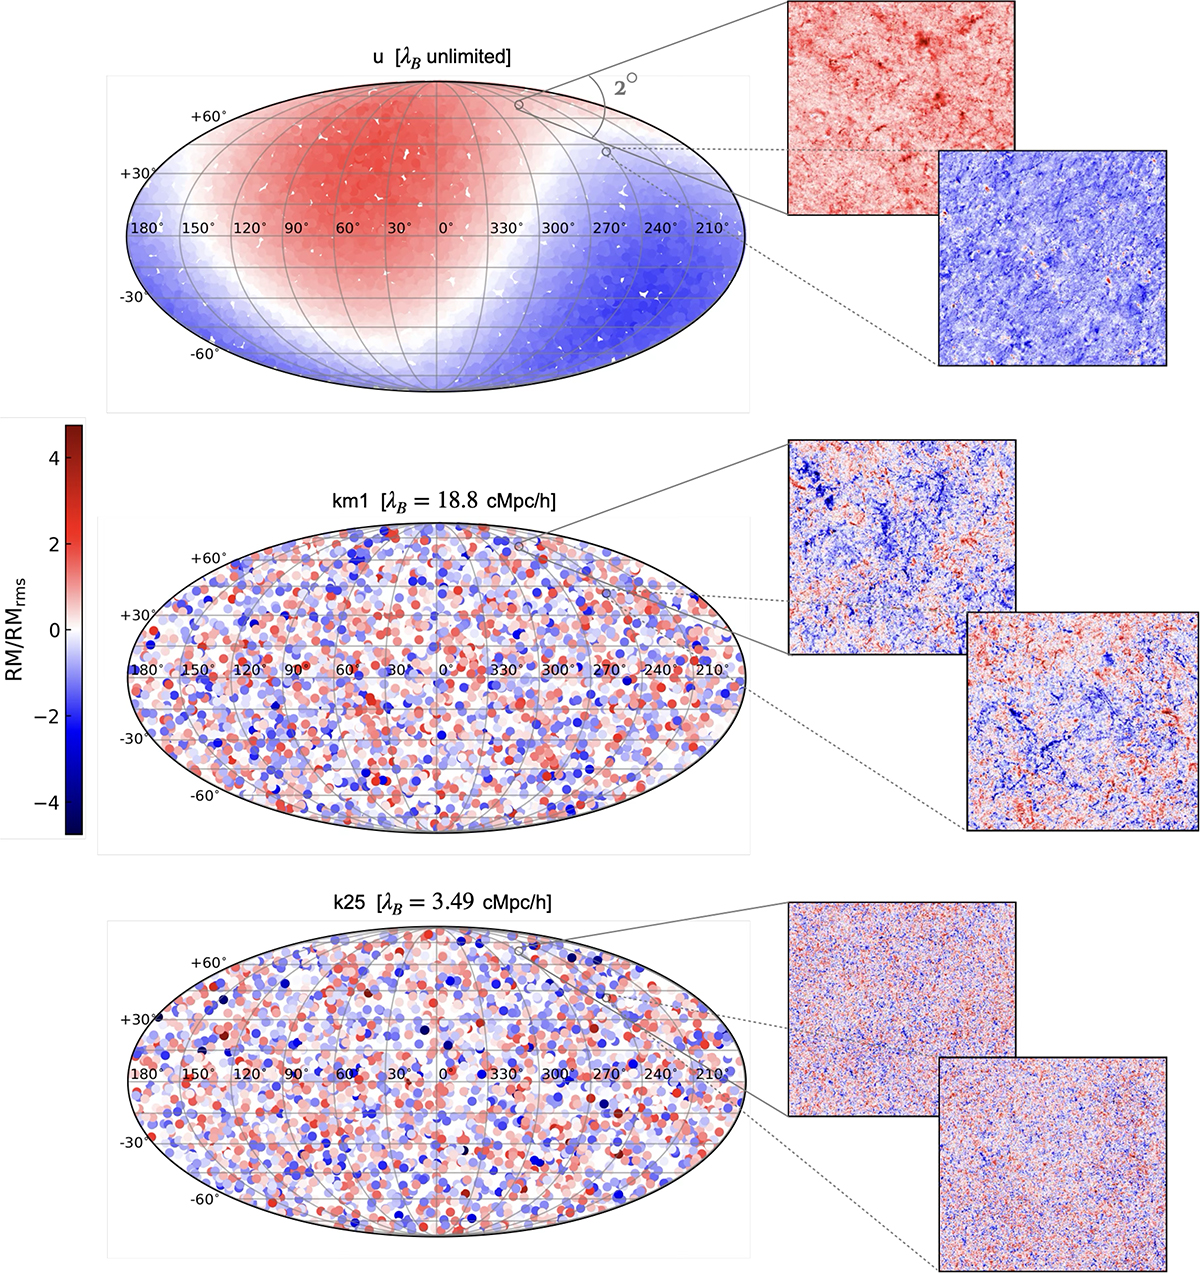
Fig. 3.
Download original image
Constructed RMIGM maps [rad/m2] for three PMF models studied in this work at z = 2 redshift depth. The left part of the figure depicts the mean ⟨RMIGM⟩ distribution in Galactic coordinates with 10 000 and ∼3300 light-cone realisations in the uniform, and km1 and k25 cases, respectively (in the latter cases a smaller number of realisations was chosen for a better visualisation). The right part shows example 2D light-cone maps (with 2° FOVs and 20″ image resolution) used for calculating RMIGM statistics.
Current usage metrics show cumulative count of Article Views (full-text article views including HTML views, PDF and ePub downloads, according to the available data) and Abstracts Views on Vision4Press platform.
Data correspond to usage on the plateform after 2015. The current usage metrics is available 48-96 hours after online publication and is updated daily on week days.
Initial download of the metrics may take a while.