


Fig. 10.
Download original image
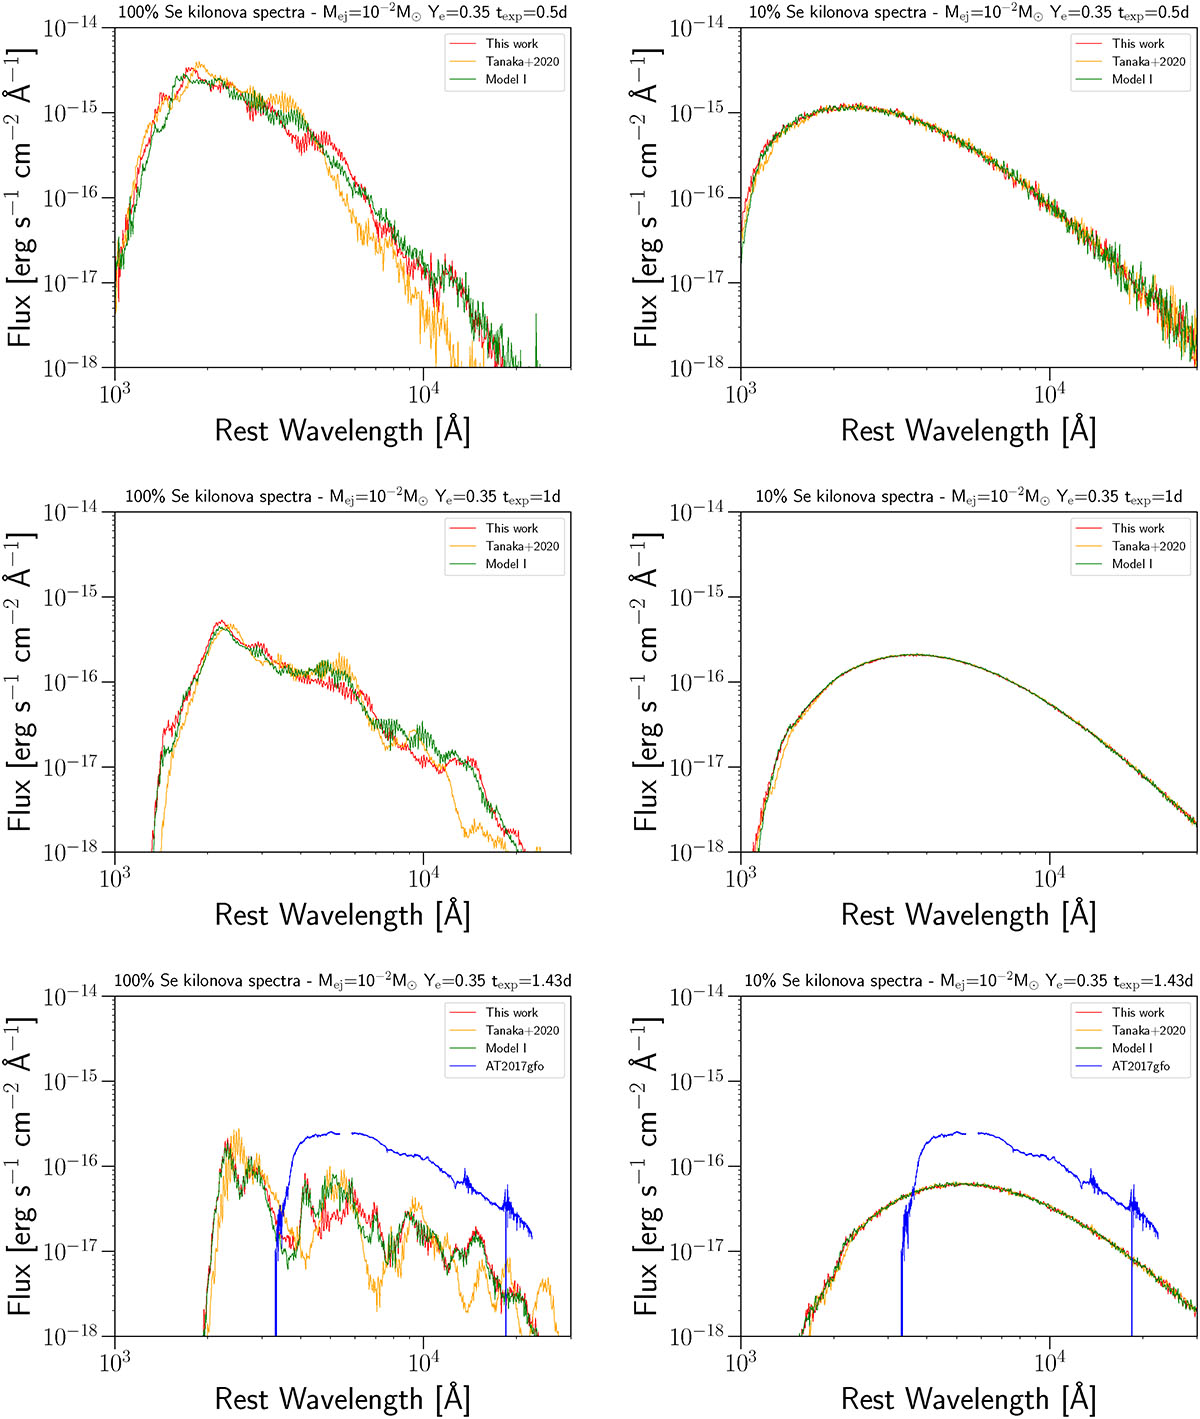
KN spectra comparison between the three different models, generated through the POSSIS code and calculated at 40 Mpc of distance. Each row represents a different time epoch: 0.5 d, 1 d, 1.43 d, respectively. The columns identify different KN ejecta compositions: on the left column, the spectra of panels (a), (c), and (e), are generated by an opacity contribution of 100% of Se. The right columns, (b), (d), and (f), are calculated by considering Se at 10%, and a grey opacity of  for the remaining 90% of the composition. In the last epoch, we also included the AT2017gfo spectrum for a consistent comparison in the analysis.
Current usage metrics show cumulative count of Article Views (full-text article views including HTML views, PDF and ePub downloads, according to the available data) and Abstracts Views on Vision4Press platform.
Data correspond to usage on the plateform after 2015. The current usage metrics is available 48-96 hours after online publication and is updated daily on week days.
Initial download of the metrics may take a while.