| Issue |
A&A
Volume 706, February 2026
|
|
|---|---|---|
| Article Number | A102 | |
| Number of page(s) | 12 | |
| Section | Extragalactic astronomy | |
| DOI | https://doi.org/10.1051/0004-6361/202556835 | |
| Published online | 03 February 2026 | |
On the baryon budget in the X-ray-emitting circumgalactic medium of Milky Way-mass galaxies
1
Max-Planck-Institut für extraterrestrische Physik (MPE) Gießenbachstraße 1 D-85748 Garching bei München, Germany
2
INAF-Osservatorio Astronomico di Brera Via E. Bianchi 46 I-23807 Merate (LC), Italy
3
Como Lake Center for Astrophysics (CLAP), DiSAT, Università degli Studi dell’Insubria via Valleggio 11 22100 Como, Italy
4
Department of Astronomy, Tsinghua University Beijing 100084, People’s Republic of China
5
Purple Mountain Observatory, Chinese Academy of Sciences 10 Yuanhua Road Nanjing 210023, People’s Republic of China
6
Department of Astronomy, University of Michigan Ann Arbor MI 48109, USA
7
Department of Astronomy, Xiamen University Xiamen Fujian 361005, China
★ Corresponding author: This email address is being protected from spambots. You need JavaScript enabled to view it.
Received:
12
August
2025
Accepted:
22
November
2025
Abstract
Recent observations with SRG/eROSITA reveal the average X-ray surface brightness profile of the X-ray-emitting circumgalactic medium (CGM) around Milky Way (MW)-mass galaxies, offering valuable insights into the baryon budget in these systems. However, the estimation of the baryon mass depends critically on several assumptions regarding the gas density profile, temperature, metallicity, and the underlying halo mass distribution. Here, we assess how these assumptions affect the inferred baryon mass of the X-ray-emitting CGM in MW-mass galaxies, based on the stacked eROSITA signal. We find that variations in temperature profiles and uncertainties in the halo mass introduce the dominant sources of uncertainty, resulting in X-ray-emitting baryon mass estimates that vary by nearly a factor of four (0.8–3.5 × 10¹¹ M⊙). Assumptions about metallicity contribute an additional uncertainty of approximately 50%. We emphasize that accurate X-ray spectral constraints on gas temperature and metallicity, along with careful modeling of halo mass uncertainty, are essential for accurately estimating the baryon mass for MW-mass galaxies. Future X-ray microcalorimeter missions will be crucial for determining the hot CGM properties and closing the baryon census at the MW-mass scale.
Key words: galaxies: evolution / galaxies: halos / X-rays: galaxies
© The Authors 2026
 Open Access article, published by EDP Sciences, under the terms of the Creative Commons Attribution License (https://creativecommons.org/licenses/by/4.0), which permits unrestricted use, distribution, and reproduction in any medium, provided the original work is properly cited.
This article is published in open access under the Subscribe to Open model.
Open Access funding provided by Max Planck Society.
1. Introduction
In the standard cosmological model, baryonic matter constitutes approximately 0.157 ± 0.001 of the total matter content of the Universe and forms the objects we can observe (Planck Collaboration VI 2020). A large fraction of these baryons resides in the intergalactic medium (IGM), traced through Lyα forest, O VI and O VII absorbers, and fast radio burst (FRB) dispersion measures; a small fraction of the baryons is found within the potential wells of galaxy systems, in the form of stars and gas (e.g., Shull et al. 2012; Nicastro et al. 2018; Connor et al. 2025; Chen & Zahedy 2024). Notably, only the baryon mass (Mb) enclosed within R500c of the most massive galaxy clusters (M500c ≈ 1015 M⊙) matches the cosmological value1 (i.e., Mb/M500c ≈ 0.157, Eckert et al. 2021). However, for virialized galaxy structures of decreasing halo mass, an increasing fraction of baryons within R500c remains unaccounted for (McGaugh et al. 2010; Dai et al. 2012; Li et al. 2017; Eckert et al. 2021; Dev et al. 2024; Popesso et al. 2024). There are two main explanations for the low detected baryon mass in lower-mass galaxy systems. First, baryons may have been ejected beyond R500c or even depleted from the gravitational potential wells of galaxies via active galactic nucleus (AGN) feedback. This interpretation is supported by the observed flatter gas density profiles of the intracluster medium (ICM) compared to those of dark matter halos (e.g., Sun et al. 2009; Eckert et al. 2016), as well as by numerical simulations (Gaspari et al. 2012; Sorini et al. 2022; Wright et al. 2024; Nelson et al. 2024; Ayromlou et al. 2024). Second, the low observed baryon fraction is due to observational limitations, as the CGM (or the intragroup medium) of galaxies with M500c < 1014 M⊙ has low X-ray emissivity, making it difficult to detect.
The mass of the MW’s X-ray-emitting CGM is estimated from O VII and O VIII emission and absorption line measurements, based on tens to hundreds of XMM-Newton and Chandra sightlines (Gupta et al. 2012; Miller & Bregman 2013; Henley & Shelton 2013; Miller & Bregman 2015; Fang et al. 2015; Hodges-Kluck et al. 2016; Nicastro et al. 2016; Li & Bregman 2017; Faerman et al. 2017; Bregman et al. 2018). The reported baryon mass estimates are summarized in Appendix A. In general, the X-ray-emitting gas mass within 250 kpc ranges from less than 3 × 10¹⁰ M⊙ to values more than 1011 M⊙. One reason for this wide range is our location: the gas density profile slope is difficult to constrain due to projection effects. Indeed, several studies report that a disk-like hot component with a scale height of < 3 kpc and a temperature of T ≈ 0.2 keV can explain most of the observed X-ray emission (Yao & Wang 2007; Kaaret et al. 2020; Locatelli et al. 2024).
In nearby massive galaxies (M* ∼ 1011 M⊙) with extended X-ray emission detected out to 10–100 kpc, the gas density profile of the X-ray-emitting CGM is typically modeled with a beta profile, with β ≈ 0.4 − 0.6 (Yao et al. 2009; Wang 2010; Humphrey et al. 2011; Anderson & Bregman 2011; Dai et al. 2012; Bogdán et al. 2013; Anderson et al. 2016; Li et al. 2018; Bregman et al. 2022, see also the review by Bregman et al. 2018). The total baryon content within the virial radius requires extrapolating the gas density profile, which introduces significant uncertainty.
Apart from pointed observations toward individual galaxies, the average X-ray surface brightness (SX) in the 0.5 − 2 keV energy band of MW-mass galaxies is measured through stacking analyses out to ≈ 150 kpc (Zhang et al. 2024). While targeted X-ray observations of the MW and nearby galaxies provide constraints on the temperature of the X-ray-emitting CGM, determining the temperature from stacked measurements across the broad 0.5–2 keV energy band remains challenging (Toptun et al. 2025). This difficulty arises from the limited photon statistics available for X-ray spectral analysis. In light of these limitations, we discuss in this paper how different assumptions about the temperature, metallicity, gas density profile, and the uncertainty in the underlying galaxy halo mass affect the estimation of the X-ray-emitting gas mass within the virial radius (Rvir) of MW-mass galaxies. We focus on the MW-mass galaxies, as they dominate the stellar mass budget at low redshift (Driver et al. 2022), and they are the most sensitive to the various assumptions2. For our analysis, we adopt the SX profile of the MW-mass central galaxy (CEN) sample from Zhang et al. (2024) as a benchmark to evaluate the associated X-ray-emitting gas mass (or baryon fraction) with different assumptions. We assume an NFW-shaped dark matter halo for MW-mass galaxies (Navarro et al. 1997), with a fiducial virial mass (radius) of Mvir = 1.3 × 10¹² M⊙ (Rvir = 285 kpc).
2. X-ray emission and baryon mass
The integrated 0.5–2 keV X-ray emission produced by fully ionized plasma with temperature (T), metallicity (Z), and hydrogen number densities (nH) is given by
![Mathematical equation: $$ \begin{aligned} \epsilon _{X,\,0.5-2\,\mathrm {keV}}=\Lambda _{0.5-2\,\mathrm {keV}} (T,Z) \mu _{\rm e} n_{\rm H}^2 \,{[\mathrm {erg\, s}^{-1}\, \mathrm {cm}^{-3}]}, \end{aligned} $$](/articles/aa/full_html/2026/02/aa56835-25/aa56835-25-eq1.gif) (1)
(1)
where Λ0.5−2 keV(T,Z) is the X-ray cooling function in the 0.5–2 keV band, which depends on the plasma temperature and metallicity. μe ≈ 1.16 is the ratio of electron to hydrogen number densities (Lodders 2003).
We assume that the hot CGM is spherically symmetric and volume-filling3, such that T, Z, and nH depend only on radius r. The X-ray surface brightness profile SX(r) is obtained by integrating ϵX along the line of sight (dl) as
![Mathematical equation: $$ \begin{aligned} S_{\rm X}(r)=\int \epsilon _{\rm X}(r) \,dl\,{[\mathrm {erg\, s}^{-1}\, \mathrm {kpc}^{-2}]}. \end{aligned} $$](/articles/aa/full_html/2026/02/aa56835-25/aa56835-25-eq2.gif) (2)
(2)
Since SX scales with nH2, the X-ray emission is dominated by the densest regions (e.g., the inner CGM). Assuming the plasma is in collisional ionization equilibrium, Λ0.5−2 keV is highly sensitive to both the temperature and metallicity of the plasma, particularly when the plasma temperature is around 0.1 keV (Böhringer & Werner 2010, also see Fig.6 in Grayson et al. 2025). For plasma with T ≈ 0.1 − 0.2 keV, the 0.5–2 keV spectrum is dominated by lines from ions such as O VII, O VIII, Fe XVII. These lines exhibit a strong temperature dependence, as the corresponding ionization fractions of the ions decrease sharply below ∼0.2 keV. For example, when the temperature decreases from 0.1 keV to 0.09 keV, Λ0.5−2 keV drops by approximately 50% (assuming metallicity of 0.3 Z⊙ and fixed H and He abundances). Similarly, if the metallicity decreases from 0.3 Z⊙ to 0.1 Z⊙ (assuming T = 0.1 keV), Λ0.5−2 keV decreases by about 60%. Therefore, deriving the gas mass from SX profile of MW-mass galaxies (such as Zhang et al. 2024), whose CGM is expected to have a temperature on the order of 0.1 keV, requires careful assumptions about T(r), Z(r), and nH(r) profile.
The X-ray emission observed around nearby galaxies suggests that the hot gas density profile can be described by a beta model (e.g., Li & Wang 2013)
![Mathematical equation: $$ \begin{aligned} n_{\rm H}=n_{0}(1+(r/r_{\rm c})^2)^{-3\beta /2}\,[\mathrm {cm}^{-3}], \end{aligned} $$](/articles/aa/full_html/2026/02/aa56835-25/aa56835-25-eq3.gif) (3)
(3)
where n0 is the central gas density, rc is the core radius, and β determines the slope of the nH(r) profile. The mass of the X-ray-emitting gas within the virial radius, Rvir, is then calculated as
![Mathematical equation: $$ \begin{aligned} M_{\mathrm{{X-ray-emitting}}, < R_{\rm {vir}}} = 4\pi \mu _{\rm H} m_{\rm p}\int _0^{R_{\rm {vir}}} n_{\rm H}r^2 dr\,[M_\odot ], \end{aligned} $$](/articles/aa/full_html/2026/02/aa56835-25/aa56835-25-eq4.gif) (4)
(4)
where μHmp is the mean mass per hydrogen (μH ≈ 1.32). A typical range of β = 0.4–0.6 within ≈100 kpc of galaxies with log(M*/M⊙) = 10.5–11.5 implies a radial baryon mass profile of dMX − ray − emitting, < Rvir/dr ∝ r0.2–r0.8 (see review in Bregman et al. 2018). This indicates that the baryon mass is dominated by the outer halo4, in contrast to the X-ray emission, which is dominated by the inner halo, underscoring the importance of carefully assessing the assumptions used to derive the gas density profile from the 0.5 − 2 keV SX profile.
We began by adopting a fiducial model in which the gas density profile follows a beta model with β = 0.4 and rc = 5 kpc (Zhang et al. 2024), a metallicity of 0.3 Z⊙ (Anderson & Bregman 2010), and an isothermal temperature of T = 0.12 keV (see discussion in Sect 2.2). We also took the fiducial Mvir and Rvir. By fitting this model to the observed SX profile from Zhang et al. (2024), we derived an X-ray-emitting gas mass within Rvir of MX − ray − emitting, < Rvir = 1.26 ± 0.09 × 10¹¹ M⊙ and a corresponding baryon fraction of fX − ray − emitting, < Rvir = MX − ray − emitting, < Rvir/Mvir = 0.097 ± 0.007 with a reduced χ2 = 0.3 for the fit5. Note that fX − ray − emitting, < Rvir does not include the baryon content in stars (the median stellar mass of stacked galaxies in Zhang et al. (2024) is M* = 5.5 × 10¹⁰ M⊙, which yields fb, * = M*/Mvir = 0.042), or the cooler, non-X-ray-emitting phase of the CGM (Werk et al. 2014; Peeples et al. 2014; Tumlinson et al. 2017; Chen et al. 2020; Tchernyshyov et al. 2022; Ng et al. 2025). A more detailed discussion is provided in Appendix A.
In the following sections, we vary the assumed T, Z, and nH profile relative to the fiducial case and consider the effect of uncertainties in the halo mass of MW-mass galaxies. The results are summarized in Fig. 1.
 |
Fig. 1. Derived baryon mass fraction of the X-ray-emitting gas within Rvir based on the mean X-ray surface brightness profile of MW-mass central galaxies from Zhang et al. (2024). We evaluate the effects of different assumptions on the inferred baryon fraction, including: nH profile (Sect. 2.1); isothermal temperature value (Sect. 2.2); lognormal distribution of temperature, ExpCGM model, and TNG-based forward model (Sect. 2.3); halo mass uncertainty (Sect. 2.4); and metallicity (Sect. 2.5). The vertical dashed line indicates the cosmological baryon fraction (fb = 0.157). |
2.1. Dependence on the gas density profile
The SX profile of MW-mass galaxies beyond ∼150 kpc has not yet been measured (Zhang et al. 2024), leading to significant uncertainties in the nH profile at large radii. In this section, we examined how modifications to the assumed nH profile affect the inferred MX − ray − emitting, < Rvir and fX − ray − emitting, < Rvir.
To explore the possible variations in the CGM gas density profile, we took guidance from the better-measured SX profile of the ICM. Typical ICM SX profile exhibits complicated structures, including a central core, and a steep decline at large radii (Vikhlinin et al. 2006; Arnaud et al. 2010; Eckert et al. 2016; Popesso et al. 2025a). As a result, a single beta model is insufficient to describe the ICM, and the Vikhlinin model is commonly adopted (Vikhlinin et al. 2006). We modified the fiducial nH profile to (i) a steeper beta model with β = 0.5, and (ii) a modified Vikhlinin profile,
 (5)
(5)
with the fiducial values of β and rc, and adopting rs = 200 kpc and ϵ = 4, as suggested by Shreeram et al. (2025b)6. Fitting the β = 0.5 model to the observed SX profile yields MX − ray − emitting, < Rvir = 8.6 ± 0.5 × 10¹⁰ M⊙ (fX − ray − emitting, < Rvir = 0.066 ± 0.004, reduced χ2 = 1.2). Fitting the modified Vikhlinin model yields MX − ray − emitting, < Rvir = 10.1 ± 0.7 × 10¹⁰ M⊙ (fX − ray − emitting, < Rvir = 0.078 ± 0.005, reduced χ2 = 0.8). The fX − ray − emitting, < Rvir values inferred from these two nH models are about 30% and 20% lower, respectively, than the fiducial value. Larger (> 2 times) optical galaxy samples from large-volume surveys, such as DESI BGS and 4MOST, will become available within the next five years, substantially improving the measurements of the SX profile at large radii (Hahn et al. 2023; Driver et al. 2019; Finoguenov et al. 2019). Ultimately, narrow-band (e.g., in O VII and O VIII lines) imaging enabled by future microcalorimeter X-ray telescopes will suppress the cosmic X-ray background, enhance the signal-to-noise ratio of the hot CGM X-ray emission, and constrain the gas density profile at large radii with high precision (Li 2020; Barret et al. 2023; Bregman et al. 2023).
2.2. Temperature dependence
The temperature of the MW’s X-ray-emitting halo has been measured as 0.19 ± 0.05 keV using 110 XMM-Newton sightlines (Henley & Shelton 2013), 0.166 ± 0.005 keV from the HaloSat all-sky survey (Bluem et al. 2022), 0.176 ± 0.008 keV from Suzaku observations (Gupta et al. 2021), and 0.153 − 0.178 keV in the eFEDS field (Ponti et al. 2023). These temperatures are derived from line-of-sight-integrated emission or absorption, and the radial temperature variation remains unknown. Temperatures inferred from X-ray emission are biased toward the densest regions (e.g., those near the Galactic disk), which may not represent the conditions in lower-density regions of the halo.
For nearby star-forming galaxies with stellar masses 1–10 × 1010 M⊙, the X-ray-emitting gas temperature ranges from 0.2 to 0.8 keV (Li et al. 2017). For early-type galaxies with M* ≈ 1011 M⊙, the temperatures measured within 30 kpc are typically 1.4 − 2 times higher than the corresponding virial temperatures (Goulding et al. 2016; Bregman et al. 2018). The relatively higher temperatures within ∼50 kpc suggest that stellar feedback may substantially heat the gas, and that selection biases toward X-ray-luminous or hotter systems may be present (Li et al. 2017), as also found at the galaxy group scale (Marini et al. 2025).
Overall, the temperature profile of MW-mass galaxies remains poorly constrained. Varying the temperature in the fiducial model to 0.17 keV (i.e., consistent with the MW’s CGM) yields an X-ray-emitting gas mass of 7.7 ± 0.5 × 10¹⁰ M⊙ and a corresponding baryon fraction of 0.059 ± 0.004, slightly higher than the MW estimates (0.027 − 0.047, Miller & Bregman (2015)).
The conventional theoretical assumption for the CGM temperature is the isothermal “virial” temperature (Tϕ), which is related to the circular velocity Vc of the dark matter (DM) halo by (Maller & Bullock 2004)
 (6)
(6)
Under the singular isothermal sphere assumption, the DM halo density follows ρDM ∝ r−2, implying a constant  . The MW’s circular velocity is approximately 200 km/s (Bland-Hawthorn & Gerhard 2016; Beordo et al. 2024), corresponding to a virial temperature of ≈ 0.12 keV, which we adopted as the fiducial value7.
In reality, for an NFW-shaped halo, Vc is not constant. For the MW, Vc is about 235 km/s at the solar radius and decreases roughly as r−1/2 (Jiao et al. 2023; Beordo et al. 2024). If we instead assume an isothermal halo with Tϕ evaluated at R500c (about 0.08 keV), we obtain an X-ray-emitting gas mass of 3.5 ± 0.2 × 10¹¹ M⊙ and fX − ray − emitting, < Rvir = 0.271 ± 0.016, which significantly exceeds the cosmic baryon fraction.
We note that Zhang et al. (2024) estimated the hot baryon mass using the isothermal assumption with Tϕ taken at Rvir (Tvir). As discussed above, and further in later sections, the isothermal Tvir assumption is oversimplified, and the associated uncertainty in the derived baryon fraction is significantly underestimated. Moreover, the Tvir adopted in Zhang et al. (2024) is overestimated by a factor of about 3, such that Tvir of MW-mass galaxies was taken as 0.22 keV, while the correct Tvir should be 0.06 keV. By coincidence, the overestimated Tvir = 0.22 keV is close to the observed temperature of the MW halo. In Appendix B, we discuss how fX − ray − emitting, < Rvir for other mass bins in Zhang et al. (2024) depends on different assumptions regarding temperature, metallicity, and halo mass. However, a more accurate determination of fX − ray − emitting, < Rvir requires a forward-modeling approach that self-consistently accounts for the stacking procedure (see Sect. 2.6), as well as future X-ray spectral analyses.
Because M500c ∝ R500c3, Eq. (6) suggests  , the so-called self-similar model, which assumes that the thermodynamic properties of the ICM are determined solely by gravity and that the gas is in hydrostatic equilibrium (Kaiser 1986; Lovisari et al. 2021). Observations and simulations, however, indicate a shallower scaling, with kBT–M500c slopes of 0.57–0.66 for galaxy groups and clusters (Sun et al. 2009; Eckmiller et al. 2011; Lovisari et al. 2015; Kettula et al. 2015; Pop et al. 2022; Toptun et al. 2025), likely due to additional heating from feedback processes. Using T = 4.3 keV at M500c = 3 × 10¹⁴ M⊙ (Lovisari et al. 2021) and extrapolating this relation down to MW-mass halos yields temperatures of 0.09–0.15 keV, corresponding to MX − ray − emitting, < Rvir = 2.5 ± 0.2 × 10¹¹ M⊙ (fX − ray − emitting, < Rvir = 0.192 ± 0.013) and MX − ray − emitting, < Rvir = 8.8 ± 0.5 × 10¹⁰ M⊙ (fX − ray − emitting, < Rvir = 0.068 ± 0.004), as shown in Fig. 1 and listed in Table B.1.
In summary, variations in the assumed isothermal T cause fX − ray − emitting, < Rvir to vary dramatically between 6–27%, underscoring the importance of reliable temperature measurements for accurately estimating the gas mass in MW–mass galaxies. This large uncertainty in fX − ray − emitting, < Rvir arises from the strong temperature dependence of Λ0.5−2 keV on T for plasma with T ∼ 0.1 keV. For more massive galaxies, where the CGM temperature is typically T > 0.2 keV, Λ0.5−2 keV becomes less sensitive to T, for example, increasing T by 10% (from 0.2 to 0.22 keV) raises Λ0.5−2 keV by ∼13%. As a result, the inferred X-ray-emitting gas mass of galaxy groups and clusters depends less strongly on the assumed T, see the discussion in Appendix B.
2.3. Non-isothermal temperature
Small-scale temperature fluctuations driven by turbulence have been suggested by both observations (Faerman et al. 2017; Qu et al. 2024; Lovisari et al. 2024) and simulations (Blaisdell et al. 1993; Padoan et al. 1997; McCourt et al. 2012). These fluctuations are often modeled with a lognormal temperature distribution
 (7)
(7)
where Tmed is the median temperature and σ is the logarithmic scatter. A model with Tmed = 0.12 keV and σ ≈ 0.3 (Faerman et al. 2017), or a normal distribution with Tmed = 0.225 keV and σT ≈ 0.023 keV (Kaaret et al. 2020), has been proposed to reproduce the MW’s O VII/O VIII absorption and emission data.
To quantify the impact of a lognormal temperature distribution on the derived gas mass, we adopted Tmed equal to the fiducial temperature and σ = 0.3, following Faerman et al. (2017). We find that the lognormal distribution introduces a high-temperature tail, increasing the mean X-ray emissivity by about 30%. Consequently, to maintain the same observed SX, the inferred MX − ray − emitting, < Rvir and fX − ray − emitting, < Rvir decrease by about 13% relative to the fiducial isothermal case. The influence of this effect can be even more pronounced at lower temperatures. For example, a plasma with a lognormal distribution of Tmed = 0.08 keV, and σ = 0.3 emits X-rays that are ∼2.5 times brighter than a plasma with an isothermal T = 0.08 keV (i.e., T500c that we adopted in Sect. 2.2). This would yield fX − ray − emitting, < Rvir = 0.17 ± 0.01, approximately 160% lower than the value obtained under the isothermal T = 0.08 keV assumption.
The CGM temperature is also unlikely to remain constant with radius, as suggested by both simulations (Truong et al. 2023; Ramesh et al. 2023; Shreeram et al. 2025c) and observations of the ICM (Vikhlinin et al. 2005; Arnaud et al. 2010) and the MW’s CGM (Yao & Wang 2007; Yao et al. 2009; Feldmann et al. 2013; Bregman et al. 2018). Using O VIII/O VII and Fe-L/(O VIII + O VII) line ratios from XMM-Newton archival data, Qu et al. (2024) found that the halo temperature decreases from ∼0.18 keV toward the Galactic center to ∼0.07 keV in the anti-Galactic direction.
Several theoretical models (e.g., the precipitation model and the cooling flow model) have been proposed to explain the structure of the CGM, and all predict a temperature that decreases with radius (see discussion and references in Singh et al. 2024). While a comprehensive comparison of these models is beyond the scope of this paper, we adopted the physically motivated ExpCGM framework8, which provides a self-consistent description of the gaseous halo using a minimal set of four parameters. We assumed purely thermal pressure (fth = 1), hydrostatic equilibrium (fϕ = 1, dP/ρ dr = −dΦ/dr), an NFW dark matter halo, and a generalized NFW-like pressure shape function (α(r)) as
 (8)
(8)
where rmax is the radius where the circular velocity peaks (held fixed). The equilibrium pressure (PHSE(r)) profile is then
 (9)
(9)
where P0 is the pressure normalization, which is a function of fb. The equilibrium temperature profile relates to Tϕ and α as
 (10)
(10)
and the gas density profile is related to PHSE and THSE as nH = PHSE(r)/(kBTHSE(r)).
For example, in the ExpCGM framework, an isothermal condition corresponds to α(r) = 2, which yields PHSE ∝ r−2, THSE = Tϕ, independent of the pressure gradient. If |α| is smaller (higher) than 2, THSE is higher (lower) than Tϕ.
Using the ExpCGM framework, we derived pressure, temperature, and gas density self-consistently from three free parameters α0, α1, and fb, by fitting to the observed SX profile. To ensure gas confinement, we imposed dlnP/dlnr > 1.5 at Rvir. The best fit to the observed SX profile yields α0 = 0.6 ± 0.2, α1 = 1.1 ± 0.3, and fX − ray − emitting, < Rvir = 0.11 ± 0.01 (Mgas, < Rvir = 1.4 ± 0.1 × 10¹¹ M⊙). The inferred temperature decreased from ∼ 0.2 keV at r = 30 kpc to ∼ 0.1 keV at R500c.
However, the assumptions we made under the ExpCGM framework may oversimplify the physical state of the CGM. For MW-mass galaxies, the CGM (at least in the inner halo) may not be in complete hydrostatic equilibrium (Faucher-Giguère & Oh 2023; Jana et al. 2024; Kakoly et al. 2025). Moreover, nonthermal pressure support (e.g., from turbulence and cosmic rays) and cooler CGM phases may contribute significantly to the total pressure budget, as suggested by the simulations (Gaspari & Churazov 2013; Quataert & Hopkins 2025; Kakoly et al. 2025). Nevertheless, as a self-consistent model, the ExpCGM framework enables simultaneous fitting to multiple observables (e.g., X-ray, Sunyaev–Zel’dovich (SZ) effect, and FRB dispersion measures). Actually, the Descriptive Parametric Model (DPM) introduced by Oppenheimer et al. (2025) follows a similar logic to the ExpCGM, but further accounts for the dependence of halo properties on halo mass and redshift. Oppenheimer et al. (2025) apply the DPM formalism to explain diverse observables, including X-ray surface brightness profiles, Compton y parameter profile from thermal SZ observations, electron dispersion measures, O VI column density profile, etc.
Cosmological simulations are an essential tool for interpreting systematics in the observed SX profile, for example, the projection effect, miscentering, halo mass uncertainties, and mass distribution, which have been discussed in, for example, Shreeram et al. (2025b), Popesso et al. (2025b), Grayson et al. (2025). Simulations with different feedback prescriptions exhibit distinct baryonic behaviors and provide valuable insight into the properties of the hot CGM, as they incorporate a wide range of physical processes (Wright et al. 2024; Braspenning et al. 2024; Lau et al. 2025; Dolag et al. 2025). The TNG300-based lightcone (LC-TNG) developed by Shreeram et al. (2025b) is specifically designed to model the hot gas emission in the redshift range 0.03 ≲ z ≲ 0.3. LC-TNG generates self-consistent mock X-ray observations using the intrinsic gas cell information from TNG300. Halos are projected onto the sky, and SX profiles are extracted following the same stacking strategy used in observations, allowing direct comparison with real data (Shreeram et al. 2025a). We find that the X-ray profile of halos with M200c ≈ 2 × 10¹² M⊙ in LC-TNG agrees well with observations within 80 kpc9, yielding fX − ray − emitting, < Rvir = 0.0469 ± 0.007 (MX − ray − emitting, < Rvir = 6.1 ± 0.9 × 10¹⁰ M⊙). The simulated temperature profile decreases with radius, from ∼0.2 keV at the center to ∼0.1 keV at R500c (see Fig. 5 in Shreeram et al. 2025c). It is important to note that simulations typically compute mass-weighted or volume-weighted temperatures of hot (i.e., T > 105.5 K) gas particles, whereas observations measure an emission-weighted temperature, Temi, via spectral fitting. Pop et al. (2022) find that Temi is typically ∼9% higher than the mass-weighted temperature and exhibits about twice the scatter. This systematic difference should be considered when comparing simulated and observed temperature measurements.
Future X-ray microcalorimeter telescopes with spectral resolution of ∼ 2 eV can separate prominent O VII and O VIII lines associated with the hot CGM around galaxies at z > 0.01 from MW foreground emission, and constrain the multi-temperature components of the hot CGM through detailed X-ray spectral analysis (Zhang et al. 2022), along with a large effective area or field of view to ensure sufficient photon collection within reasonable exposure times (e.g., Cui et al. 2020; Cruise et al. 2025).
2.4. Dependence on the halo mass
The MW’s halo mass is inferred through tracers such as halo stars, globular clusters, satellite galaxies, and tidal streams (Gibbons et al. 2014; Vasiliev 2019; Callingham et al. 2019; Cautun et al. 2020; Shen et al. 2022; Ibata et al. 2024), which yield a broad range of estimates, from 5.5 × 10¹¹ M⊙ to 2.6 × 10¹² M⊙, with a commonly adopted value of 1.3 ± 0.3 × 10¹², M⊙ (namely about 0.1 dex uncertainty Bland-Hawthorn & Gerhard 2016; McMillan 2017). For external galaxies, halo masses are typically estimated from the circular velocity function, satellite kinematics, and abundance matching (Paturel et al. 2003; Crook et al. 2007; Yang et al. 2007; Tempel et al. 2016; Mandelbaum et al. 2016; Tinker 2021, 2022; Popesso et al. 2025a; Marini et al. 2025), with typical uncertainties of ≲ 0.2 dex (Tinker 2022). Notice that the uncertainty of the mean halo mass of a complete galaxy sample is much smaller than 0.2 dex, instead, the scatter of the halo mass of the galaxy sample is about 0.15 − 0.2 dex (Matthee et al. 2017; Tinker 2017; Popesso et al. 2025a).
We assessed the effect of halo mass uncertainty by assuming 0.1 dex (representative of the MW) and 0.2 dex. The halo mass uncertainty affects the estimation of fX − ray − emitting, < Rvir in two ways. First, it has a direct effect as the denominator when calculating fX − ray − emitting, < Rvir. Second, it has a side effect if the temperature is assumed from the kBT–M500c relation. Considering only the direct effect, uncertainties of 0.1 dex and 0.2 dex yield MX − ray − emitting, < Rvir = 1.2 ± 0.2 × 10¹¹ M⊙ (fX − ray − emitting, < Rvir = 0.09 ± 0.01) and MX − ray − emitting, < Rvir = 1.2 ± 0.3 × 10¹¹ M⊙ (fX − ray − emitting, < Rvir = 0.09 ± 0.02), respectively. If considering also the side effect in temperature, 0.1 dex and 0.2 dex uncertainties yield MX − ray − emitting, < Rvir = 1.5 ± 0.7 × 10¹¹ M⊙ (fX − ray − emitting, < Rvir = 0.11 ± 0.05) and MX − ray − emitting, < Rvir = 2.0 ± 1.2 × 10¹¹ M⊙ (fX − ray − emitting, < Rvir = 0.15 ± 0.09), respectively. In summary, for MW-mass galaxies, if no spectral constraints on the X-ray-emitting gas are available and the temperature is instead inferred from the halo mass, an overestimation (underestimation) of the halo mass by 0.1 dex can lead to an underestimation (overestimation) of fX − ray − emitting, < Rvir by about 30% (60%).
2.5. Metallicity dependence
Measuring the metallicity of the CGM is observationally challenging. From pulsar dispersion measure toward the Large Magellanic Cloud, the metallicity is constrained to be Z ≳ 0.3 Z⊙ (Anderson & Bregman 2010; Miller & Bregman 2015). Using integrated soft X-ray emission observed by eROSITA in the eFEDS field, Ponti et al. (2023) obtain Z ∼ 0.1 Z⊙ for the outer CGM of the MW. Within < 50 kpc, the CGM metallicity of nearby massive galaxies (M* ≈ 3 × 10¹¹ M⊙) has been measured to be ∼0.1 − 0.2 Z⊙ (Bogdán et al. 2013; Anderson et al. 2016; Bogdán et al. 2017). For massive galaxy clusters, the metallicity of the ICM is ∼0.3 Z⊙ beyond 0.3 R500c, rising toward the central galaxy to 0.6 − 1 Z⊙ (Mernier et al. 2018; Gastaldello et al. 2021; Sarkar et al. 2022).
We tested several metallicity assumptions: i) a constant Z = 0.1 Z⊙, ii) a constant Z = Z⊙ (used as an upper limit, though not physically realistic), and iii) a radially varying profile inspired by ICM measurements, with Z = 0.3 Z⊙ beyond 0.3 R500c (44 kpc) and increasing inward as Z = 0.2 Z⊙(r/R500c)−0.3, reaching 0.8 Z⊙ at 0.01 R500c. The inferred fX − ray − emitting, < Rvir values are shown in Fig. 1. In general, fX − ray − emitting, < Rvir varies between 0.05 − 0.16. The accurate measurement of the X-ray-emitting CGM metallicity relies on the X-ray microcalorimeter telescopes (Barret et al. 2023; XRISM Science Team 2020; Zhang et al. 2022).
2.6. Other assumptions
There are additional systematic uncertainties in estimating the X-ray-emitting gas mass from the observed stacked 0.5–2 keV SX profile that are not covered in the above discussion. We assumed that the mean SX profile of MW-mass galaxies measured by stacking 30 825 galaxies with log(M*/M⊙) = 10.5 − 11.0 represents the SX profile of a galaxy with Mvir = 1.3 × 10¹² M⊙ (Zhang et al. 2024). However, two sources of scatter in the stacking measurements must be taken into account. First, there is a large spread (σlog(Mh),16 − 84% = 0.8 dex) in the halo mass distribution of the stacked galaxy sample. The stacked signal is the mean value from all galaxies, while the more massive and brighter galaxies contribute more to the X-ray signal. As a result, the mean SX measured in the stacking is not the median SX of the stacked galaxy sample. Second, there is intrinsic scatter in SX among galaxies of similar halo mass. While the discussion in Sect. 2.4 provides a preliminary estimation of the impact of halo mass distribution, a forward modeling that accounts for the halo mass and temperature distributions of the X-ray–emitting gas, as well as the intrinsic scatter as a function of halo mass over the range from 1012 M⊙ to 1014 M⊙ is necessary to explain the observed SX profile and scaling relations (e.g., Comparat et al. 2025).
While plasma in collisionally ionized equilibrium is usually assumed to explain the X-ray emission from the hot CGM, several additional physical processes, though likely subdominant, may also contribute. To increase the completeness of the discussion, we briefly list these processes here without quantifying their impact:
-
The charge exchange occurring at the interfaces between neutral and ionized gas (e.g., between cooling inflows and volume-filling hot gas) may contribute to the soft X-ray emission (e.g., Wang & Liu 2012; Lopez et al. 2020).
-
Near the galaxy disk and in the CGM outskirts where gas densities are ∼ 10−5 cm−3, photoionization can modify the plasma ionization balance and the X-ray spectrum (e.g., Fox et al. 2005; Qu & Bregman 2018).
-
The resonant scattering process can modify the SX profile slope, especially in the inner halo (Nelson et al. 2023).
-
The inverse Compton scattering between cosmic rays and the cosmic microwave background (CMB) emits X-rays that may contribute to the total signal around MW-mass galaxies (Ji et al. 2020; Stein et al. 2023; Silich et al. 2025; Hopkins et al. 2025; Lu et al. 2025). X-ray spectral analysis (especially emission and absorption line features) will be critical to disentangling thermal and nonthermal emission components.
In this work, we examined the effects of varying nH, T, Z, and halo mass assumptions individually. But in reality, the assumptions are not independent of each other. For instance, the assumed halo mass directly influences the expected temperature, and the physical properties of the CGM are jointly determined by theoretical assumptions, feedback models, and baryonic processes, as treated self-consistently in frameworks such as ExpCGM and in cosmological simulations. Propagating the combined uncertainties shown in Fig. 1 into a total error is therefore nontrivial and will require dedicated future analysis.
3. Conclusions
We show that the inferred X-ray-emitting baryon mass in the CGM of MW-mass galaxies derived from the mean 0.5 − 2 keV energy band SX profile measured in Zhang et al. (2024) is highly sensitive to assumptions about gas temperature, halo mass, metallicity, and gas density profile. Under a fiducial model with an isothermal T = 0.12 keV, Z = 0.3 Z⊙, and a beta profile with β = 0.4, we obtain fX − ray − emitting, < Rvir = 0.084 ± 0.005. Modifying the gas density slope to β = 0.5 or assuming a modified Vikhlinin profile with a steep nH ∼ r−3.2 at large radii (> 200 kpc) changes fX − ray − emitting, < Rvir by 20–30%. When varying temperature assumptions, including isothermal temperatures (0.17 keV, 0.08 keV, and temperatures extrapolated from the T − M500c scaling relation observed in galaxy clusters), and considering the lognormal temperature distribution, fX − ray − emitting, < Rvir can vary by more than a factor of four. Adopting a physically motivated ExpCGM model yields fX − ray − emitting, < Rvir = 0.113 ± 0.011, and comparison with the LC-TNG simulations gives fX − ray − emitting, < Rvir ≈ 0.047 ± 0.007. A 0.2 dex uncertainty in halo mass further introduces up to a factor of four variation in fX − ray − emitting, < Rvir. Varying the metallicity from 0.1 Z⊙ to Z⊙ changes fX − ray − emitting, < Rvir by up to a factor of three.
In addition, other emission mechanisms and scatter in the halo mass further compound the uncertainties in fX − ray − emitting, < Rvir. As such, the 0.5 − 2 keV energy band X-ray surface brightness profile alone is insufficient to robustly constrain the baryon mass of the CGM for MW-mass galaxies. A differentiable forward-modeling approach, guided by simulations and incorporating realistic systematics, to synthesize the information from SZ, FRBs, and X-rays, is needed. Joint modeling of X-ray and SZ observations with halo masses calibrated by weak lensing has narrowed down the uncertainty of the gas mass (e.g., Oren et al. 2024; Siegel et al. 2025). X-ray spectral measurements with eROSITA’s CCD spectral resolution can put constraints on the CGM temperature (Toptun et al. 2025). Ultimately, high-resolution spectral analysis enabled by future X-ray telescopes (e.g., NewAthena, HUBS, Arcus, LEM) will be essential to break the degeneracies discussed here and resolve the “missing” baryon problem in galaxies (Smith et al. 2016; Cui et al. 2020; Kraft et al. 2022; Zhang et al. 2022; Barret et al. 2023; Cruise et al. 2025; Zhang et al. 2025).
Acknowledgments
We thank Rahul Ramesh and Xiaoyuan Zhang for the helpful discussions. We thank Philip F. Hopkins for noticing the virial temperature error in Zhang et al. (2024), which motivated this paper. This project acknowledges financial support from the European Research Council (ERC) under the European Union’s Horizon 2020 research and innovation program HotMilk (grant agreement No. 865637). GP acknowledges support from the European Research Council (ERC) under the European Union’s Horizon 2020 research and innovation program HotMilk (grant agreement No. 865637), support from Bando per il Finanziamento della Ricerca Fondamentale 2022 dell’Istituto Nazionale di Astrofisica (INAF): GO Large program and from the Framework per l’Attrazione e il Rafforzamento delle Eccellenze (FARE) per la ricerca in Italia (R20L5S39T9). T. F. is supported by the National Natural Science Foundation of China under Nos. 11890692, 12133008, 12221003. J.T.L. acknowledges the financial support from the National Science Foundation of China (NSFC) through the grants 12321003 and 12273111, and Jiangsu Innovation and Entrepreneurship Talent Team Program through the grant JSSCTD202436. T. F. and J.T.L. acknowledge the science research grants from the China Manned Space Project with No. CMS-CSST-2021-A04 and No. CMS-CSST-2025-A10.
References
- Anderson, M. E., & Bregman, J. N. 2010, ApJ, 714, 320 [Google Scholar]
- Anderson, M. E., & Bregman, J. N. 2011, ApJ, 737, 22 [NASA ADS] [CrossRef] [Google Scholar]
- Anderson, M. E., Churazov, E., & Bregman, J. N. 2016, MNRAS, 455, 227 [NASA ADS] [CrossRef] [Google Scholar]
- Arnaud, M., Pratt, G. W., Piffaretti, R., et al. 2010, A&A, 517, A92 [CrossRef] [EDP Sciences] [Google Scholar]
- Ayromlou, M., Nelson, D., Pillepich, A., et al. 2024, A&A, 690, A20 [NASA ADS] [CrossRef] [EDP Sciences] [Google Scholar]
- Barret, D., Albouys, V., Herder, J.-W. d., et al. 2023, Exp. Astron., 55, 373 [NASA ADS] [CrossRef] [Google Scholar]
- Beordo, W., Crosta, M., Lattanzi, M. G., Re Fiorentin, P., & Spagna, A. 2024, MNRAS, 529, 4681 [Google Scholar]
- Blaisdell, G. A., Mansour, N. N., & Reynolds, W. C. 1993, J. Fluid Mech., 256, 443 [Google Scholar]
- Bland-Hawthorn, J., & Gerhard, O. 2016, ARA&A, 54, 529 [Google Scholar]
- Bluem, J., Kaaret, P., Kuntz, K. D., et al. 2022, ApJ, 936, 72 [NASA ADS] [CrossRef] [Google Scholar]
- Bogdán, Á., Forman, W. R., Vogelsberger, M., et al. 2013, ApJ, 772, 97 [CrossRef] [Google Scholar]
- Bogdán, Á., Bourdin, H., Forman, W. R., et al. 2017, ApJ, 850, 98 [CrossRef] [Google Scholar]
- Böhringer, H., & Werner, N. 2010, A&A Rev., 18, 127 [CrossRef] [Google Scholar]
- Braspenning, J., Schaye, J., Schaller, M., et al. 2024, MNRAS, 533, 2656 [NASA ADS] [CrossRef] [Google Scholar]
- Bregman, J. N., Anderson, M. E., Miller, M. J., et al. 2018, ApJ, 862, 3 [NASA ADS] [CrossRef] [Google Scholar]
- Bregman, J. N., Hodges-Kluck, E., Qu, Z., et al. 2022, ApJ, 928, 14 [NASA ADS] [CrossRef] [Google Scholar]
- Bregman, J., Cen, R., Chen, Y., et al. 2023, Sci. China Phys. Mech. Astron., 66, 299513 [NASA ADS] [CrossRef] [Google Scholar]
- Callingham, T. M., Cautun, M., Deason, A. J., et al. 2019, MNRAS, 484, 5453 [Google Scholar]
- Cautun, M., Benítez-Llambay, A., Deason, A. J., et al. 2020, MNRAS, 494, 4291 [Google Scholar]
- Chen, H. W., & Zahedy, F. S. 2024, arXiv e-prints [arXiv:2412.10579] [Google Scholar]
- Chen, H.-W., Zahedy, F. S., Boettcher, E., et al. 2020, MNRAS, 497, 498 [NASA ADS] [CrossRef] [Google Scholar]
- Comparat, J., Merloni, A., Ponti, G., et al. 2025, A&A, 697, A173 [NASA ADS] [CrossRef] [EDP Sciences] [Google Scholar]
- Connor, L., Ravi, V., Sharma, K., et al. 2025, Nat. Astron., 9, 1226 [Google Scholar]
- Crook, A. C., Huchra, J. P., Martimbeau, N., et al. 2007, ApJ, 655, 790 [Google Scholar]
- Cruise, M., Guainazzi, M., Aird, J., et al. 2025, Nat. Astron., 9, 36 [Google Scholar]
- Cui, W., Chen, L. B., Gao, B., et al. 2020, J. Low Temp. Phys., 199, 502 [NASA ADS] [CrossRef] [Google Scholar]
- Dai, X., Anderson, M. E., Bregman, J. N., & Miller, J. M. 2012, ApJ, 755, 107 [NASA ADS] [CrossRef] [Google Scholar]
- Dev, A., Driver, S. P., Meyer, M., et al. 2024, MNRAS, 535, 2357 [Google Scholar]
- Dolag, K., Remus, R. S., Valenzuela, L. M., et al. 2025, A&A, submitted, [arXiv:2504.01061] [Google Scholar]
- Driver, S. P., Liske, J., Davies, L. J. M., et al. 2019, The Messenger, 175, 46 [NASA ADS] [Google Scholar]
- Driver, S. P., Bellstedt, S., Robotham, A. S. G., et al. 2022, MNRAS, 513, 439 [NASA ADS] [CrossRef] [Google Scholar]
- Eckert, D., Ettori, S., Coupon, J., et al. 2016, A&A, 592, A12 [NASA ADS] [CrossRef] [EDP Sciences] [Google Scholar]
- Eckert, D., Gaspari, M., Gastaldello, F., Le Brun, A. M. C., & O’Sullivan, E. 2021, Universe, 7, 142 [NASA ADS] [CrossRef] [Google Scholar]
- Eckmiller, H. J., Hudson, D. S., & Reiprich, T. H. 2011, A&A, 535, A105 [NASA ADS] [CrossRef] [EDP Sciences] [Google Scholar]
- Faerman, Y., & Werk, J. K. 2023, ApJ, 956, 92 [NASA ADS] [CrossRef] [Google Scholar]
- Faerman, Y., Sternberg, A., & McKee, C. F. 2017, ApJ, 835, 52 [NASA ADS] [CrossRef] [Google Scholar]
- Fang, T., Buote, D., Bullock, J., & Ma, R. 2015, ApJS, 217, 21 [NASA ADS] [CrossRef] [Google Scholar]
- Faucher-Giguère, C.-A., & Oh, S. P. 2023, ARA&A, 61, 131 [CrossRef] [Google Scholar]
- Feldmann, R., Hooper, D., & Gnedin, N. Y. 2013, ApJ, 763, 21 [Google Scholar]
- Finoguenov, A., Merloni, A., Comparat, J., et al. 2019, The Messenger, 175, 39 [NASA ADS] [Google Scholar]
- Fox, A. J., Wakker, B. P., Savage, B. D., et al. 2005, ApJ, 630, 332 [NASA ADS] [CrossRef] [Google Scholar]
- Gaspari, M., & Churazov, E. 2013, A&A, 559, A78 [NASA ADS] [CrossRef] [EDP Sciences] [Google Scholar]
- Gaspari, M., Ruszkowski, M., & Sharma, P. 2012, ApJ, 746, 94 [Google Scholar]
- Gastaldello, F., Simionescu, A., Mernier, F., et al. 2021, Universe, 7, 208 [NASA ADS] [CrossRef] [Google Scholar]
- Gibbons, S. L. J., Belokurov, V., & Evans, N. W. 2014, MNRAS, 445, 3788 [NASA ADS] [CrossRef] [Google Scholar]
- Goulding, A. D., Greene, J. E., Ma, C.-P., et al. 2016, ApJ, 826, 167 [Google Scholar]
- Grayson, S., Scannapieco, E., Comparat, J., et al. 2025, ApJ, 994, 89 [Google Scholar]
- Gupta, A., Mathur, S., Krongold, Y., Nicastro, F., & Galeazzi, M. 2012, ApJ, 756, L8 [CrossRef] [Google Scholar]
- Gupta, A., Mathur, S., & Krongold, Y. 2017, ApJ, 836, 243 [Google Scholar]
- Gupta, A., Kingsbury, J., Mathur, S., et al. 2021, ApJ, 909, 164 [NASA ADS] [CrossRef] [Google Scholar]
- Hahn, C., Wilson, M. J., Ruiz-Macias, O., et al. 2023, AJ, 165, 253 [CrossRef] [Google Scholar]
- Henley, D. B., & Shelton, R. L. 2013, ApJ, 773, 92 [NASA ADS] [CrossRef] [Google Scholar]
- Hodges-Kluck, E. J., Miller, M. J., & Bregman, J. N. 2016, ApJ, 822, 21 [NASA ADS] [CrossRef] [Google Scholar]
- Hopkins, P. F., Quataert, E., Ponnada, S. B., & Silich, E. 2025, Open J. Astrophys., 8, 78 [Google Scholar]
- Humphrey, P. J., Buote, D. A., Canizares, C. R., Fabian, A. C., & Miller, J. M. 2011, ApJ, 729, 53 [CrossRef] [Google Scholar]
- Ibata, R., Malhan, K., Tenachi, W., et al. 2024, ApJ, 967, 89 [NASA ADS] [CrossRef] [Google Scholar]
- Jana, R., Sarkar, K. C., Stern, J., & Sternberg, A. 2024, MNRAS, 531, 2757 [Google Scholar]
- Ji, S., Chan, T. K., Hummels, C. B., et al. 2020, MNRAS, 496, 4221 [NASA ADS] [CrossRef] [Google Scholar]
- Jiao, Y., Hammer, F., Wang, H., et al. 2023, A&A, 678, A208 [NASA ADS] [CrossRef] [EDP Sciences] [Google Scholar]
- Kaaret, P., Koutroumpa, D., Kuntz, K. D., et al. 2020, Nat. Astron., 4, 1072 [CrossRef] [Google Scholar]
- Kaiser, N. 1986, MNRAS, 222, 323 [Google Scholar]
- Kakoly, A., Stern, J., Faucher-Giguère, C.-A., et al. 2025, MNRAS, 543, 3345 [Google Scholar]
- Kettula, K., Giodini, S., van Uitert, E., et al. 2015, MNRAS, 451, 1460 [CrossRef] [Google Scholar]
- Kraft, R., Markevitch, M., Kilbourne, C., et al. 2022, arXiv e-prints [arXiv:2211.09827] [Google Scholar]
- Lau, E. T., Nagai, D., Bogdán, Á., et al. 2025, ApJ, 984, 190 [Google Scholar]
- Li, J.-T. 2020, Astron. Nachr., 341, 177 [Google Scholar]
- Li, Y., & Bregman, J. 2017, ApJ, 849, 105 [NASA ADS] [CrossRef] [Google Scholar]
- Li, J.-T., & Wang, Q. D. 2013, MNRAS, 435, 3071 [NASA ADS] [CrossRef] [Google Scholar]
- Li, J.-T., Bregman, J. N., Wang, Q. D., et al. 2017, ApJS, 233, 20 [NASA ADS] [CrossRef] [Google Scholar]
- Li, J.-T., Bregman, J. N., Wang, Q. D., Crain, R. A., & Anderson, M. E. 2018, ApJ, 855, L24 [NASA ADS] [CrossRef] [Google Scholar]
- Locatelli, N., Ponti, G., Zheng, X., et al. 2024, A&A, 681, A78 [NASA ADS] [CrossRef] [EDP Sciences] [Google Scholar]
- Lodders, K. 2003, ApJ, 591, 1220 [Google Scholar]
- Lopez, L. A., Mathur, S., Nguyen, D. D., Thompson, T. A., & Olivier, G. M. 2020, ApJ, 904, 152 [Google Scholar]
- Lovisari, L., Reiprich, T. H., & Schellenberger, G. 2015, A&A, 573, A118 [NASA ADS] [CrossRef] [EDP Sciences] [Google Scholar]
- Lovisari, L., Ettori, S., Gaspari, M., & Giles, P. A. 2021, Universe, 7, 139 [NASA ADS] [CrossRef] [Google Scholar]
- Lovisari, L., Ettori, S., Rasia, E., et al. 2024, A&A, 682, A45 [NASA ADS] [CrossRef] [EDP Sciences] [Google Scholar]
- Lu, Y. S., Kereš, D., Hopkins, P. F., et al. 2025, MNRAS, submitted, [arXiv:2505.13597] [Google Scholar]
- Maller, A. H., & Bullock, J. S. 2004, MNRAS, 355, 694 [CrossRef] [Google Scholar]
- Mandelbaum, R., Wang, W., Zu, Y., et al. 2016, MNRAS, 457, 3200 [Google Scholar]
- Marini, I., Popesso, P., Dolag, K., et al. 2025, A&A, 694, A207 [NASA ADS] [CrossRef] [EDP Sciences] [Google Scholar]
- Matthee, J., Schaye, J., Crain, R. A., et al. 2017, MNRAS, 465, 2381 [NASA ADS] [CrossRef] [Google Scholar]
- McCourt, M., Sharma, P., Quataert, E., & Parrish, I. J. 2012, MNRAS, 419, 3319 [NASA ADS] [CrossRef] [Google Scholar]
- McGaugh, S. S., Schombert, J. M., de Blok, W. J. G., & Zagursky, M. J. 2010, ApJ, 708, L14 [NASA ADS] [CrossRef] [Google Scholar]
- McMillan, P. J. 2017, MNRAS, 465, 76 [NASA ADS] [CrossRef] [Google Scholar]
- Mernier, F., Biffi, V., Yamaguchi, H., et al. 2018, Space Sci. Rev., 214, 129 [Google Scholar]
- Miller, M. J., & Bregman, J. N. 2013, ApJ, 770, 118 [NASA ADS] [CrossRef] [Google Scholar]
- Miller, M. J., & Bregman, J. N. 2015, ApJ, 800, 14 [NASA ADS] [CrossRef] [Google Scholar]
- Navarro, J. F., Frenk, C. S., & White, S. D. M. 1997, ApJ, 490, 493 [Google Scholar]
- Nelson, D., Byrohl, C., Ogorzalek, A., et al. 2023, MNRAS, 522, 3665 [NASA ADS] [CrossRef] [Google Scholar]
- Nelson, D., Pillepich, A., Ayromlou, M., et al. 2024, A&A, 686, A157 [NASA ADS] [CrossRef] [EDP Sciences] [Google Scholar]
- Ng, Y. V., Lan, T.-W., Prochaska, J. X., et al. 2025, ApJ, 993, 92 [Google Scholar]
- Nicastro, F., Senatore, F., Krongold, Y., Mathur, S., & Elvis, M. 2016, ApJ, 828, L12 [NASA ADS] [CrossRef] [Google Scholar]
- Nicastro, F., Kaastra, J., Krongold, Y., et al. 2018, Nature, 558, 406 [Google Scholar]
- Nicastro, F., Krongold, Y., Fang, T., et al. 2023, ApJ, 955, L21 [NASA ADS] [CrossRef] [Google Scholar]
- Oppenheimer, B. D., Voit, G. M., Bahé, Y. M., et al. 2025, MNRAS, 543, 2649 [Google Scholar]
- Oren, Y., Sternberg, A., McKee, C. F., Faerman, Y., & Genel, S. 2024, ApJ, 974, 291 [Google Scholar]
- Padoan, P., Nordlund, A., & Jones, B. J. T. 1997, MNRAS, 288, 145 [NASA ADS] [CrossRef] [Google Scholar]
- Paturel, G., Petit, C., Prugniel, P., et al. 2003, A&A, 412, 45 [NASA ADS] [CrossRef] [EDP Sciences] [Google Scholar]
- Peeples, M. S., Werk, J. K., Tumlinson, J., et al. 2014, ApJ, 786, 54 [NASA ADS] [CrossRef] [Google Scholar]
- Planck Collaboration VI. 2020, A&A, 641, A6 [NASA ADS] [CrossRef] [EDP Sciences] [Google Scholar]
- Ponti, G., Zheng, X., Locatelli, N., et al. 2023, A&A, 674, A195 [NASA ADS] [CrossRef] [EDP Sciences] [Google Scholar]
- Pop, A. R., Hernquist, L., Nagai, D., et al. 2022, MNRAS, submitted, [arXiv:2205.11528] [Google Scholar]
- Popesso, P., Biviano, A., Marini, I., et al. 2024, A&A, accepted, [arXiv:2411.16555] [Google Scholar]
- Popesso, P., Marini, I., Dolag, K., et al. 2025a, A&A, 704, A278 [NASA ADS] [CrossRef] [EDP Sciences] [Google Scholar]
- Popesso, P., Marini, I., Dolag, K., et al. 2025b, A&A, 704, A277 [NASA ADS] [CrossRef] [EDP Sciences] [Google Scholar]
- Prochaska, J. X., Werk, J. K., Worseck, G., et al. 2017, ApJ, 837, 169 [CrossRef] [Google Scholar]
- Qu, Z., & Bregman, J. N. 2018, ApJ, 856, 5 [Google Scholar]
- Qu, Z., Koutroumpa, D., Bregman, J. N., Kuntz, K. D., & Kaaret, P. 2022, ApJ, 930, 21 [NASA ADS] [CrossRef] [Google Scholar]
- Qu, Z., Pan, Z., Bregman, J. N., & Liu, J. 2024, ApJ, 965, 100 [Google Scholar]
- Quataert, E., & Hopkins, P. F. 2025, Open J. Astrophys., 8, 66 [Google Scholar]
- Ramesh, R., Nelson, D., & Pillepich, A. 2023, MNRAS, 518, 5754 [Google Scholar]
- Sarkar, A., Su, Y., Truong, N., et al. 2022, MNRAS, 516, 3068 [NASA ADS] [CrossRef] [Google Scholar]
- Shen, J., Eadie, G. M., Murray, N., et al. 2022, ApJ, 925, 1 [Google Scholar]
- Shreeram, S., Comparat, J., Merloni, A., et al. 2025a, A&A, 703, A137 [NASA ADS] [CrossRef] [EDP Sciences] [Google Scholar]
- Shreeram, S., Comparat, J., Merloni, A., et al. 2025b, A&A, 697, A22 [NASA ADS] [CrossRef] [EDP Sciences] [Google Scholar]
- Shreeram, S., Galárraga-Espinosa, D., Comparat, J., et al. 2025c, A&A, submitted, [arXiv:2506.17222] [Google Scholar]
- Shull, J. M., Smith, B. D., & Danforth, C. W. 2012, ApJ, 759, 23 [NASA ADS] [CrossRef] [Google Scholar]
- Siegel, J., Amon, A., McCarthy, I. G., et al. 2025, ApJ, submitted, [arXiv:2509.10455] [Google Scholar]
- Silich, E. M., ZuHone, J., Bellomi, E., et al. 2025, ApJ, 993, 125 [Google Scholar]
- Singh, P., Lau, E. T., Faerman, Y., Stern, J., & Nagai, D. 2024, MNRAS, 532, 3222 [NASA ADS] [CrossRef] [Google Scholar]
- Smith, R. K., Abraham, M. H., Allured, R., et al. 2016, in Space Telescopes and Instrumentation 2016: Ultraviolet to Gamma Ray, eds. J. W. A. den Herder, T. Takahashi, & M. Bautz, SPIE Conf. Ser., 9905, 99054M [Google Scholar]
- Sorini, D., Davé, R., Cui, W., & Appleby, S. 2022, MNRAS, 516, 883 [CrossRef] [Google Scholar]
- Stein, M., Heesen, V., Dettmar, R.-J., et al. 2023, A&A, 670, A158 [NASA ADS] [CrossRef] [EDP Sciences] [Google Scholar]
- Sun, M., Voit, G. M., Donahue, M., et al. 2009, ApJ, 693, 1142 [NASA ADS] [CrossRef] [Google Scholar]
- Tchernyshyov, K., Werk, J. K., Wilde, M. C., et al. 2022, ApJ, 927, 147 [Google Scholar]
- Tempel, E., Kipper, R., Tamm, A., et al. 2016, A&A, 588, A14 [NASA ADS] [CrossRef] [EDP Sciences] [Google Scholar]
- Tinker, J. L. 2017, MNRAS, 467, 3533 [Google Scholar]
- Tinker, J. L. 2021, ApJ, 923, 154 [NASA ADS] [CrossRef] [Google Scholar]
- Tinker, J. L. 2022, AJ, 163, 126 [NASA ADS] [CrossRef] [Google Scholar]
- Toptun, V., Popesso, P., Marini, I., et al. 2025, A&A, 700, A167 [NASA ADS] [CrossRef] [EDP Sciences] [Google Scholar]
- Truong, N., Pillepich, A., Nelson, D., et al. 2023, MNRAS, 525, 1976 [NASA ADS] [CrossRef] [Google Scholar]
- Tumlinson, J., Thom, C., Werk, J. K., et al. 2011, Science, 334, 948 [CrossRef] [Google Scholar]
- Tumlinson, J., Peeples, M. S., & Werk, J. K. 2017, ARA&A, 55, 389 [Google Scholar]
- Vasiliev, E. 2019, MNRAS, 484, 2832 [Google Scholar]
- Vikhlinin, A., Markevitch, M., Murray, S. S., et al. 2005, ApJ, 628, 655 [Google Scholar]
- Vikhlinin, A., Kravtsov, A., Forman, W., et al. 2006, ApJ, 640, 691 [Google Scholar]
- Wang, Q. D. 2010, Proc. Nat. Acad. Sci., 107, 7168 [NASA ADS] [CrossRef] [Google Scholar]
- Wang, Q. D., & Liu, J. 2012, Astron. Nachr., 333, 373 [Google Scholar]
- Wang, Q. D., & Yao, Y. 2012, arXiv e-prints [arXiv:1211.4834] [Google Scholar]
- Werk, J. K., Prochaska, J. X., Tumlinson, J., et al. 2014, ApJ, 792, 8 [NASA ADS] [CrossRef] [Google Scholar]
- Wright, R. J., Somerville, R. S., Lagos, C. d. P., et al. 2024, MNRAS, 532, 3417 [NASA ADS] [CrossRef] [Google Scholar]
- XRISM Science Team, 2020, arXiv e-prints [arXiv:2003.04962] [Google Scholar]
- Yang, X., Mo, H. J., van den Bosch, F. C., et al. 2007, ApJ, 671, 153 [Google Scholar]
- Yao, Y., & Wang, Q. D. 2007, ApJ, 658, 1088 [Google Scholar]
- Yao, Y., Wang, Q. D., Hagihara, T., et al. 2009, ApJ, 690, 143 [NASA ADS] [CrossRef] [Google Scholar]
- Zhang, H., Zaritsky, D., & Behroozi, P. 2018, ApJ, 861, 34 [NASA ADS] [CrossRef] [Google Scholar]
- Zhang, H., Yang, X., Zaritsky, D., Behroozi, P., & Werk, J. 2020, ApJ, 888, 33 [NASA ADS] [CrossRef] [Google Scholar]
- Zhang, Y.-N., Li, C., Xu, D., & Cui, W. 2022, Exp. Astron., 53, 1053 [NASA ADS] [CrossRef] [Google Scholar]
- Zhang, Y., Comparat, J., Ponti, G., et al. 2024, A&A, 690, A267 [NASA ADS] [CrossRef] [EDP Sciences] [Google Scholar]
- Zhang, Y., Xu, D., Li, C., & Cui, W. 2025, A&A, 702, A191 [NASA ADS] [CrossRef] [EDP Sciences] [Google Scholar]
R500c is the radius at which the mean enclosed density is 500 times the critical density of the Universe. M500c is the total mass within R500c.
We discuss the baryon mass uncertainty for more massive galaxies in Appendix B.
The volume-filling factor (f) of hot CGM is heavily uncertain. The inferred baryon mass scales as f−1/2.
We note that β > 1 at large radii is required to assure the CGM mass is converged. We do not consider the convergence of the CGM mass in our fiducial assumption, instead, the assumed modified Vikhlinin profile (see Sect. 2.1) satisfies the need of CGM mass convergence.
We use MCMC to perform the fit; 0.097 is the median value and 0.007 is the 1σ uncertainty.
nH profile with β = 0.6 (β = 0.3) would provide poor fit to the observed SX profile with reduced χ2 = 3.2 (2.3).
The assumptions of an isothermal halo and an NFW-shaped DM profile are not strictly self-consistent. However, since X-ray emission from the CGM is primarily detected at small radii, Vc can be approximated as constant.
Beyond ∼80 kpc, the LC-TNG SX profile appears steeper than observed. This discrepancy can be mitigated by forward-modeling the halo mass distribution of the stacked sample, as in Shreeram et al. (2025a).
Appendix A: Detected baryon mass of MW-mass galaxies
The X-ray-emitting or X-ray-absorbing gas mass measured for MW or MW-mass galaxies spans a wide range across studies: > 6.1 × 10¹⁰ M⊙ within 139 kpc (Gupta et al. 2012, also see the discussion in Wang & Yao (2012) and Gupta et al. (2017)), 3.3−9.8 × 10¹⁰ M⊙ within 200 kpc (Miller & Bregman 2013), 0.2−1.3 × 10¹¹ M⊙ within 250 kpc (Nicastro et al. 2016), 2.8−5.2 × 10¹⁰ M⊙ within 250 kpc (Fang et al. 2015; Hodges-Kluck et al. 2016; Bregman et al. 2018; Miller & Bregman 2015; Li & Bregman 2017), 9.4 × 10¹⁰ M⊙ (Faerman et al. 2017), and 1−1.7 × 10¹¹ M⊙ within 200 kpc (Nicastro et al. 2023). The main sources of uncertainty in these measurements include the metallicity assumption, deprojection of the gas density profile, and contamination from the solar wind charge exchange (Bregman et al. 2018; Qu et al. 2022). By stacking 12 galaxies with log(M*/M⊙) = 10.6 − 11.0, the thermal SZ signal is detected out to ∼ 250 kpc with ≈4σ significance, which suggests a gas mass = 1.2 − 2.6 × 10¹¹ M⊙ within 250 kpc, by assuming the thermal SZ signal arises from a T = 0.26 keV plasma (Bregman et al. 2022).
The mass of warm (T = 105−106 K) CGM traced by UV absorption lines (e.g., O VI) spans 2 × 10^9−3 × 10¹⁰ M⊙, where the large uncertainty primarily originates from the assumption of ionization fraction (Tumlinson et al. 2011; Peeples et al. 2014; Tumlinson et al. 2017; Chen & Zahedy 2024). Using some low-ionization (e.g., Si II, Si III) absorbers in the COS-Halos survey and stacked Hα emission, the cool (T < 105 K) gas mass is estimated to be MCGM = 4 × 10¹⁰ − 1.3 × 10¹¹ M⊙ within Rvir (Werk et al. 2014; Prochaska et al. 2017; Zhang et al. 2018), where metallicity uncertainties have been explicitly considered. An analytic model developed by Faerman & Werk (2023) to interpret the COS-Halos measurements suggests a smaller cool gas mass of ≈1010 M⊙. A summary of the baryon mass measurements for different CGM phases, derived from various observational methods, is presented in Fig. A.1 and Table A.1.
Baryon budget in the CGM of MW-mass galaxies.
Appendix B: Discussions about more massive galaxies
In the main text, we discussed how the derived fX − ray − emitting, < Rvir from the observed SX profile depends on assumptions about the gas density profile, temperature, halo mass uncertainty, and metallicity for MW-mass galaxies. The mean SX profiles of galaxies in stellar mass bins log(M*/M⊙) = 11.0 − 11.25 (the ‘M31’ bin), log(M*/M⊙) = 11.25 − 11.5 (the ‘2M31’ bin), as well as in halo mass bins log(M200m/M⊙) = 12.5 − 13.0, log(M200m/M⊙) = 13.0 − 13.5, and log(M200m/M⊙) = 13.5 − 14.0 are measured in Zhang et al. (2024). Here, we extend the discussion in the main text to these five higher-mass bins to quantify how the derived fX − ray − emitting, < Rvir depends on various assumptions.
For each of the five mass bins, we take the fiducial assumption of a beta-model gas density profile (Eq. 3), an isothermal temperature of T500c (Eq. 6), a metallicity of 0.3 Z⊙, and the median Mvir, M500c, Rvir, and R500c for galaxies in that bin. Unlike in the main-text analysis, we treat β and rc as free parameters when fitting to the observed SX profiles. We then vary the fiducial assumptions individually as follows: i) a modified Vikhlinin profile (Eq.5); ii) isothermal temperatures extrapolated from the T − M500c scaling relation assuming slopes of 0.57 and 0.66 (Sect. 2.2); iii) a lognormal temperature distribution with a median temperature equal to the fiducial value and scatter σ = 0.3; iv) the ExpCGM framework (Sect. 2.3); v) considering halo mass uncertainties of 0.1 dex and 0.2 dex (Sect. 2.4); and vi) considering different metallicities (Sect. 2.5).
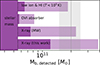 |
Fig. B.1. Baryon mass detected through different tracers as summarized in Table A.1 and Appendix A. The baryon masses are measured for the MW or L* galaxies (noting that the definition of L* varies across studies, spanning a broad range in stellar and halo mass). For reference, we take a stellar mass of 5.5 × 10¹⁰ M⊙. Dark and light purple bars indicate the lower and upper limits of detected baryon mass, respectively. The upper limit derived in this work excludes the case of an isothermal T = 0.08 keV. The gray line (and shaded bar) denotes the expected baryon mass of galaxies with Mh = 1.3 × 10¹² M⊙ (1 − 1.6 × 10¹² M⊙). |
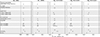 |
Fig. B.2. fX − ray − emitting, < Rvir values derived from the SX profiles measured by Zhang et al. (2024), under the different assumptions listed in Table B.1 and Table B.2. Results are shown for galaxies in stellar mass bins log(M*/M⊙) = 11.0 − 11.25 (M31), log(M*/M⊙) = 11.25 − 11.5 (2M31), as well as for halo mass bins log(M200m/M⊙) = 12.5 − 13.0, log(M200m/M⊙) = 13.0 − 13.5, and log(M200m/M⊙) = 13.5 − 14.0. The vertical dashed line indicates the cosmological baryon fraction (fb = 0.157). |
We list in Table B.1 and Table B.2 the adopted assumptions and the resulting fX − ray − emitting, < Rvir. The results are also plotted in Fig. B.1. We find that for galaxies with higher stellar or halo mass, fX − ray − emitting, < Rvir becomes less sensitive to the assumed temperature, and its uncertainty correspondingly decreases.
Properties of X-ray-emitting gas under different assumptions.
Properties of X-ray-emitting gas under different assumptions.
All Tables
All Figures
|
Fig. 1. Derived baryon mass fraction of the X-ray-emitting gas within Rvir based on the mean X-ray surface brightness profile of MW-mass central galaxies from Zhang et al. (2024). We evaluate the effects of different assumptions on the inferred baryon fraction, including: nH profile (Sect. 2.1); isothermal temperature value (Sect. 2.2); lognormal distribution of temperature, ExpCGM model, and TNG-based forward model (Sect. 2.3); halo mass uncertainty (Sect. 2.4); and metallicity (Sect. 2.5). The vertical dashed line indicates the cosmological baryon fraction (fb = 0.157). |
| In the text | |
|
Fig. B.1. Baryon mass detected through different tracers as summarized in Table A.1 and Appendix A. The baryon masses are measured for the MW or L* galaxies (noting that the definition of L* varies across studies, spanning a broad range in stellar and halo mass). For reference, we take a stellar mass of 5.5 × 10¹⁰ M⊙. Dark and light purple bars indicate the lower and upper limits of detected baryon mass, respectively. The upper limit derived in this work excludes the case of an isothermal T = 0.08 keV. The gray line (and shaded bar) denotes the expected baryon mass of galaxies with Mh = 1.3 × 10¹² M⊙ (1 − 1.6 × 10¹² M⊙). |
| In the text | |
|
Fig. B.2. fX − ray − emitting, < Rvir values derived from the SX profiles measured by Zhang et al. (2024), under the different assumptions listed in Table B.1 and Table B.2. Results are shown for galaxies in stellar mass bins log(M*/M⊙) = 11.0 − 11.25 (M31), log(M*/M⊙) = 11.25 − 11.5 (2M31), as well as for halo mass bins log(M200m/M⊙) = 12.5 − 13.0, log(M200m/M⊙) = 13.0 − 13.5, and log(M200m/M⊙) = 13.5 − 14.0. The vertical dashed line indicates the cosmological baryon fraction (fb = 0.157). |
| In the text | |
Current usage metrics show cumulative count of Article Views (full-text article views including HTML views, PDF and ePub downloads, according to the available data) and Abstracts Views on Vision4Press platform.
Data correspond to usage on the plateform after 2015. The current usage metrics is available 48-96 hours after online publication and is updated daily on week days.
Initial download of the metrics may take a while.