Fig. 8
Download original image
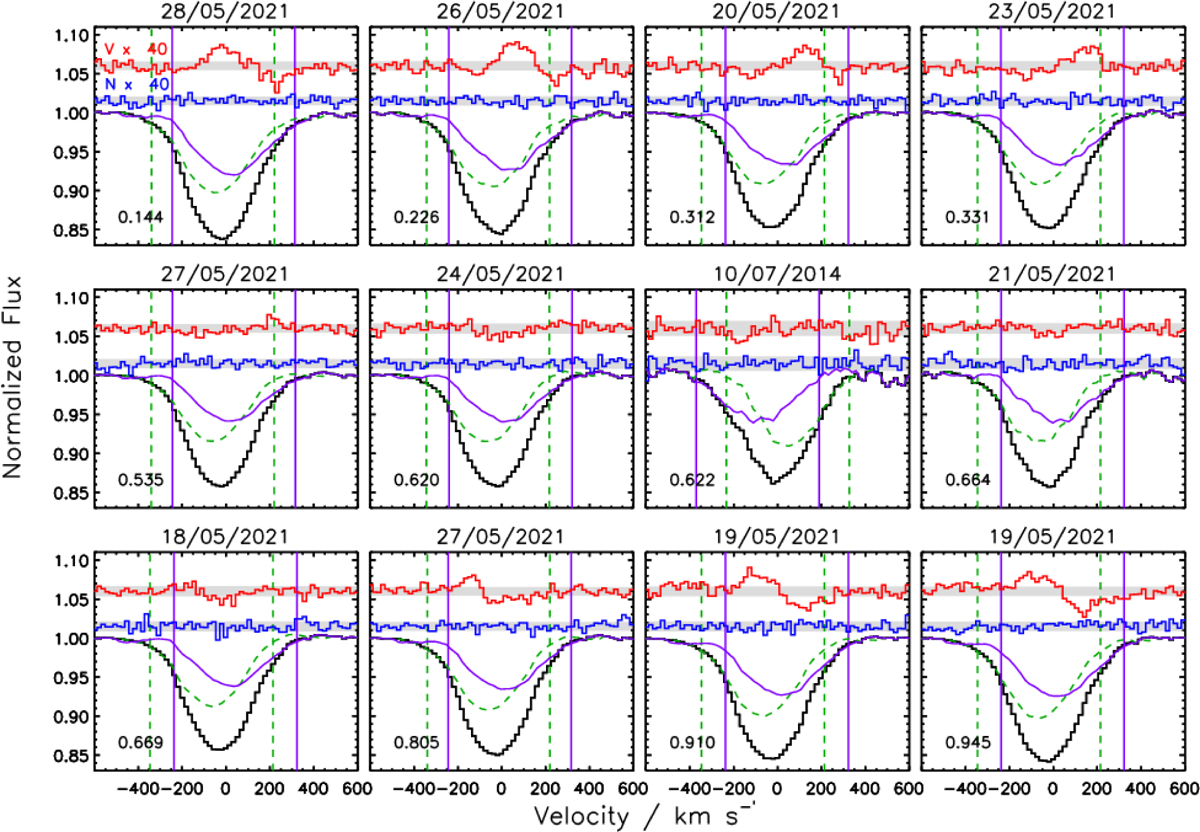
LSD Stokes I (black), N (blue), and Stokes V (red) profiles of ρ Oph A. Each panel is labelled with the date of observation (top) and the rotational phase (lower left). The top-left panel indicates the amplification applied to N and Stokes V for display purposes; these profiles have also been vertically offset for display. Dashed green and solid purple curves indicate the disentangled Stokes I profiles of Aa and Ab. Vertical dashed green and solid purple lines show the integration ranges centred on the Aa and Ab radial velocities.
Current usage metrics show cumulative count of Article Views (full-text article views including HTML views, PDF and ePub downloads, according to the available data) and Abstracts Views on Vision4Press platform.
Data correspond to usage on the plateform after 2015. The current usage metrics is available 48-96 hours after online publication and is updated daily on week days.
Initial download of the metrics may take a while.