Fig. 7
Download original image
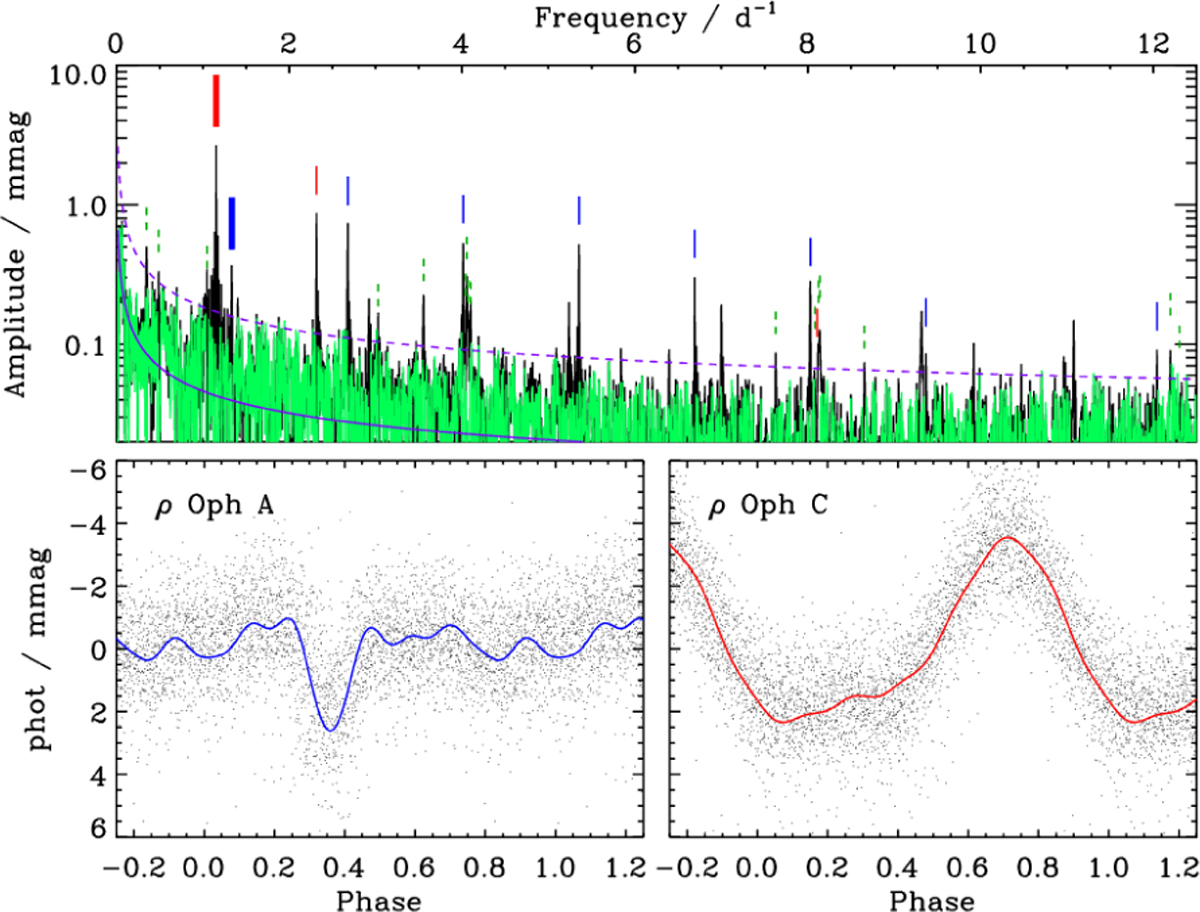
Top: periodogram for the K2 light curve of ρ Oph C. The rotational| frequencies of ρ Oph Ab and C are indicated by long, thick blue and red dashes; harmonics of these frequencies are indicated by short dashes of the same colours. Significant frequencies that are not harmonics of either of the rotational frequencies are indicated by green dashes. The pre-whitened periodogram is shown in light green. The purple curve shows the noise model determined from the pre-whitened periodogram; the dashed curve indicates 4× the noise. Bottom panels: light curves of ρ Oph A (left) and C (right), folded with their rotational frequencies and pre-whitened with all frequencies unrelated to the star’s rotation. Curves show harmonic models.
Current usage metrics show cumulative count of Article Views (full-text article views including HTML views, PDF and ePub downloads, according to the available data) and Abstracts Views on Vision4Press platform.
Data correspond to usage on the plateform after 2015. The current usage metrics is available 48-96 hours after online publication and is updated daily on week days.
Initial download of the metrics may take a while.