Fig. 12
Download original image
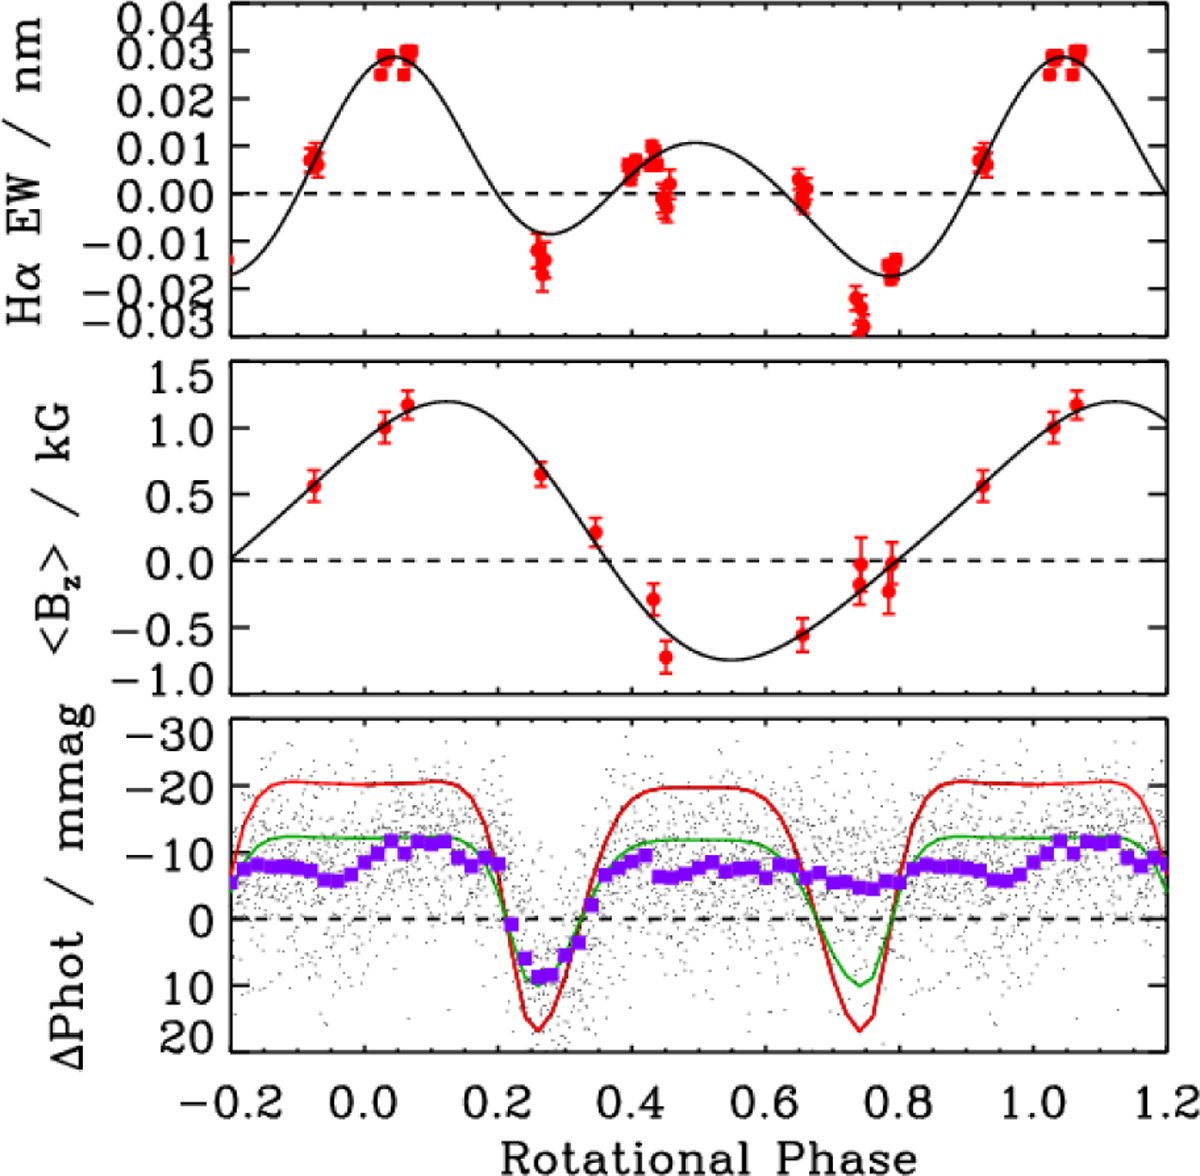
Top: Hα emission EWs across the full line (i.e. core plus wings) for ρ Oph Ab folded with the rotational phase. The dashed line indicates the continuum. The solid curve shows a harmonic fit. Middle: 〈Bɀ〉 measurements. The dashed line shows the magnetic null. The solid curve shows a harmonic fit. Bottom: K2 light curve adjusted to remove dilution from Aa, B, and C. Phase-binned data are shown by purple squares. Red and green curves show CBO-RRM models with τK = 0.1 and 0.06 respectively.
Current usage metrics show cumulative count of Article Views (full-text article views including HTML views, PDF and ePub downloads, according to the available data) and Abstracts Views on Vision4Press platform.
Data correspond to usage on the plateform after 2015. The current usage metrics is available 48-96 hours after online publication and is updated daily on week days.
Initial download of the metrics may take a while.