Fig. 11
Download original image
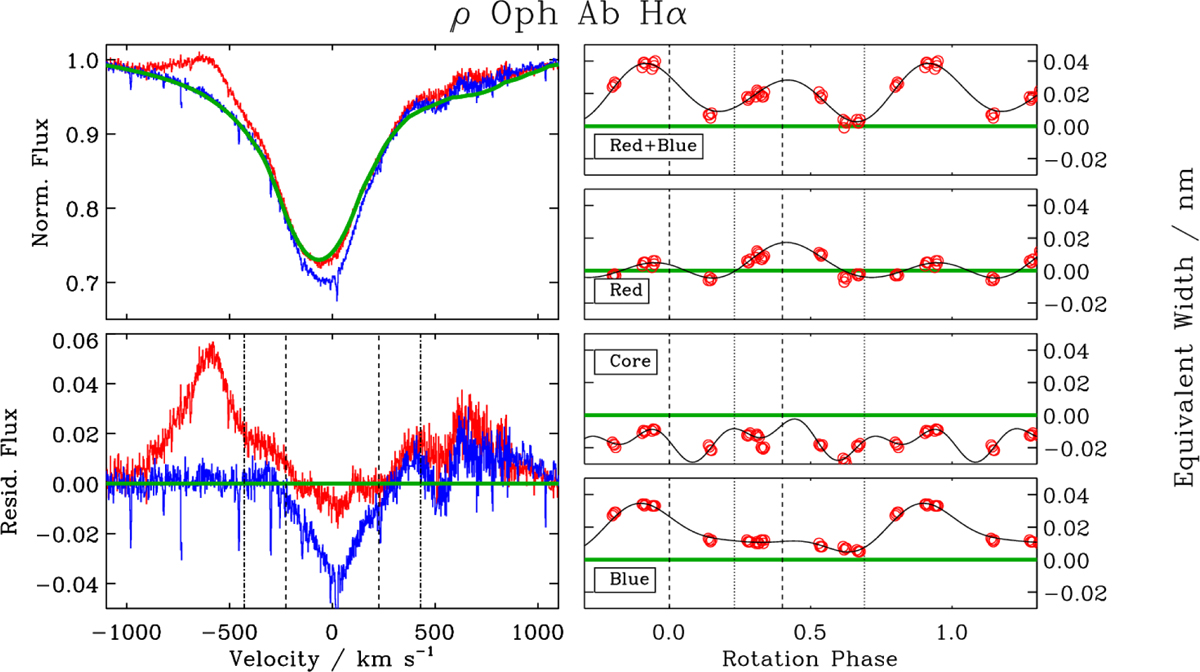
Top left: Hα profiles of ρ Oph Ab at maximum emission (red) and minimum emission (blue), shown with a synthetic spectrum (thick green). Bottom left: residual flux after subtracting the synthetic spectrum from the observed spectra. Horizontal green line indicate the continuum level. Vertical dashed and dot-dashed lines show ±υ sin i and the velocities corresponding to ±RK, respectively (since the magnetosphere cororates with the star, there is a direct linear relationship between line-of-sight velocity and projected distance). Right panels: equivalent widths measured from (bottom to top) the blue wing, the line core, the red wing, and the combined blue and red EWs. Dashed and dotted vertical lines show 〈Bz〉 extrema and nulls from the fit in Fig. 9. Horizontal thick green lines show the continuum level. Curves show harmomic fits.
Current usage metrics show cumulative count of Article Views (full-text article views including HTML views, PDF and ePub downloads, according to the available data) and Abstracts Views on Vision4Press platform.
Data correspond to usage on the plateform after 2015. The current usage metrics is available 48-96 hours after online publication and is updated daily on week days.
Initial download of the metrics may take a while.