Fig. B.1.
Download original image
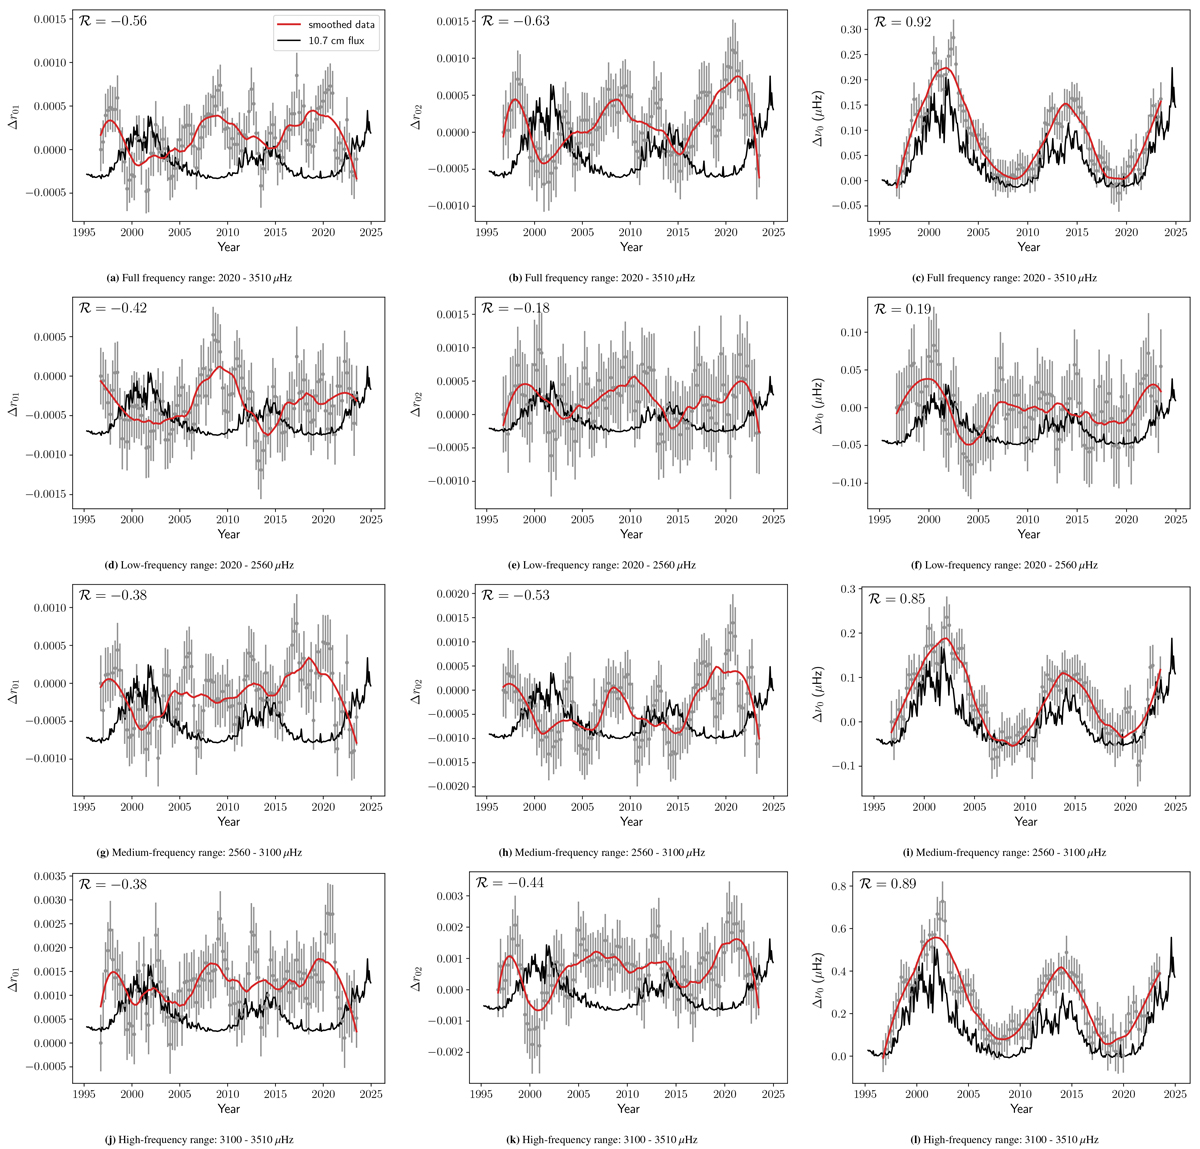
Averaged shift due to magnetic activity for frequency separation ratios r01 (left column) and r02 (middle column), and frequencies of radial modes (right column) observed by the BiSON network. Four frequency ranges were investigated: full range, low-frequency range, medium-frequency range, and high-frequency range (from top to bottom). The red line is obtained by smoothing the grey data with a Savitzky-Golay filter. The 10.7 cm radio emission flux, which serves as a proxy of the solar cycle, is denoted in black. The correlation with the activity proxy is measured with the Spearman rank coefficient ℛ.
Current usage metrics show cumulative count of Article Views (full-text article views including HTML views, PDF and ePub downloads, according to the available data) and Abstracts Views on Vision4Press platform.
Data correspond to usage on the plateform after 2015. The current usage metrics is available 48-96 hours after online publication and is updated daily on week days.
Initial download of the metrics may take a while.