Fig. C.1.
Download original image
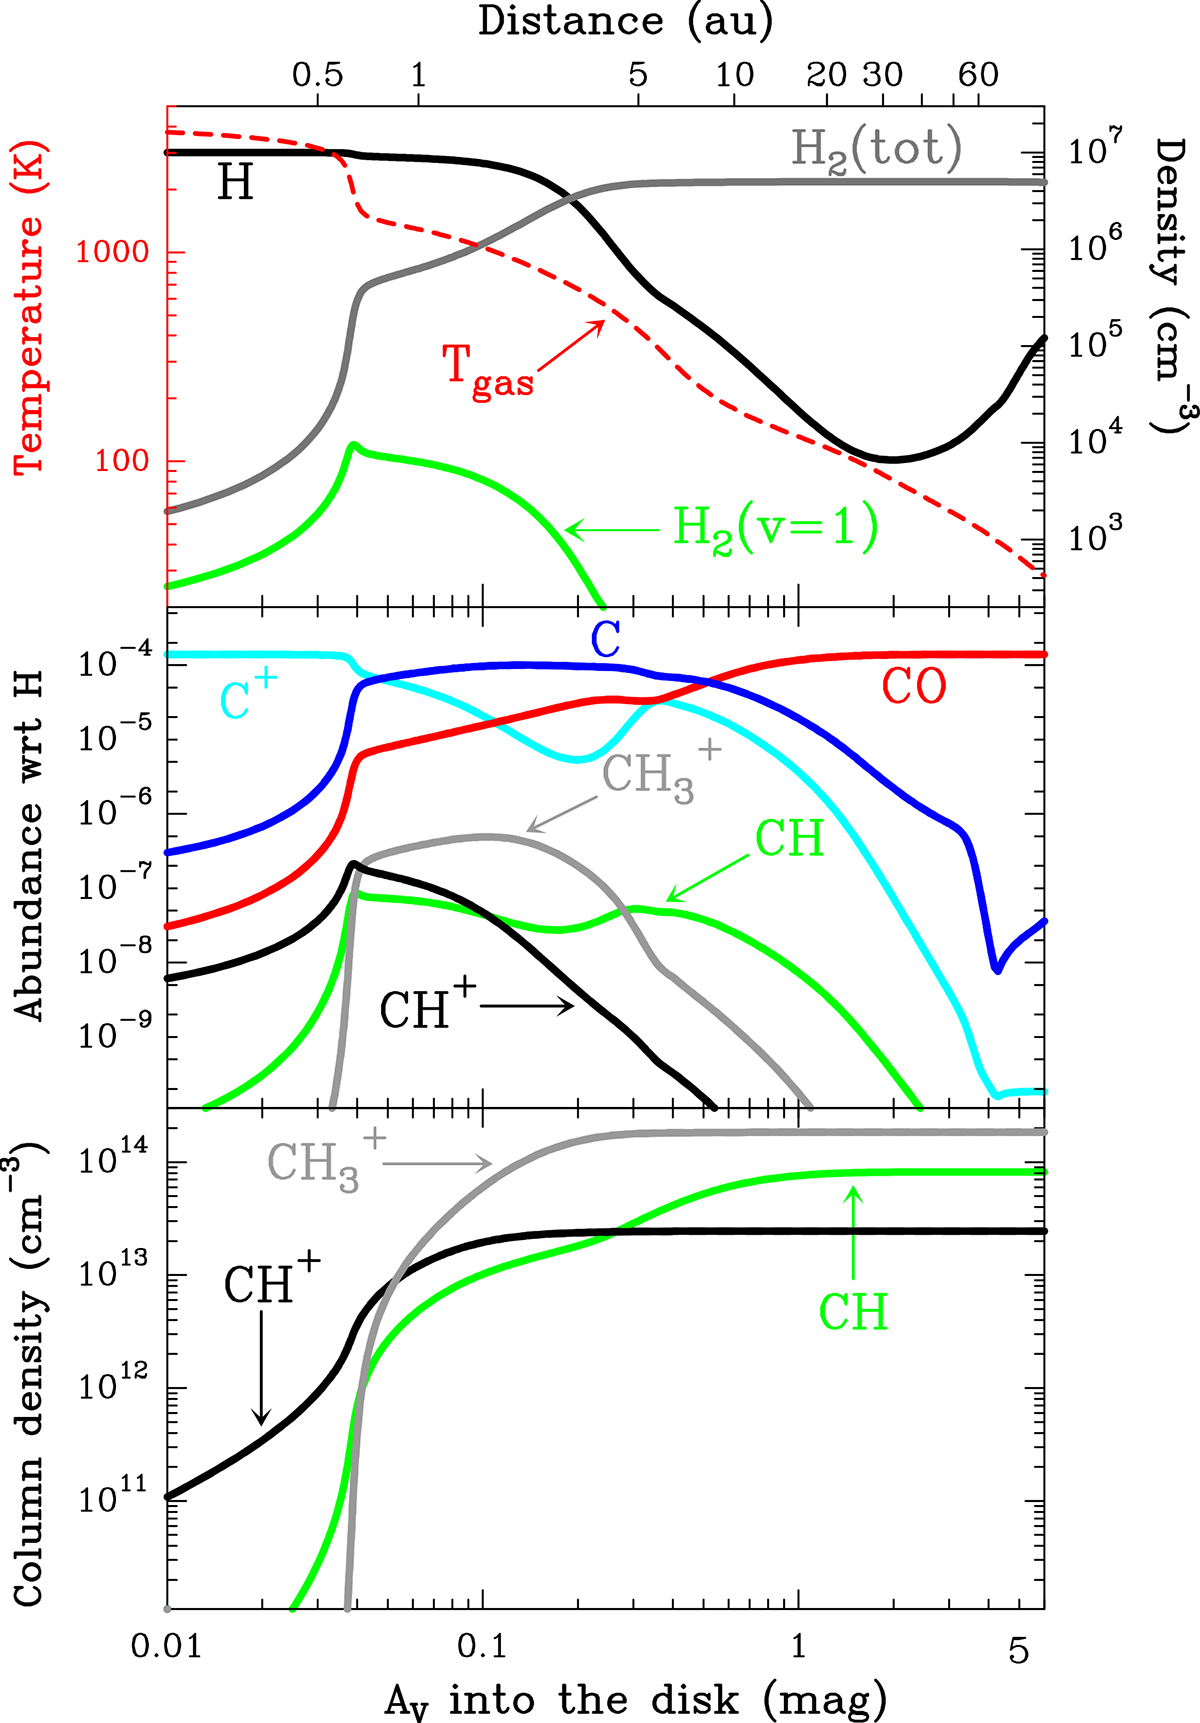
Predicted physical (roughly vertical) structure of the PDR component of d203-506. Upper panel: Gas density and temperature profiles as a function of depth into the PDR. Middle panel: Abundance profiles of selected species. Lower panel: Column densities as a function of depth into the PDR of small hydrocarbons detected by JWST in d203-506 (see also Berné et al. 2024; Zannese et al. 2025).
Current usage metrics show cumulative count of Article Views (full-text article views including HTML views, PDF and ePub downloads, according to the available data) and Abstracts Views on Vision4Press platform.
Data correspond to usage on the plateform after 2015. The current usage metrics is available 48-96 hours after online publication and is updated daily on week days.
Initial download of the metrics may take a while.