Fig. 4.
Download original image
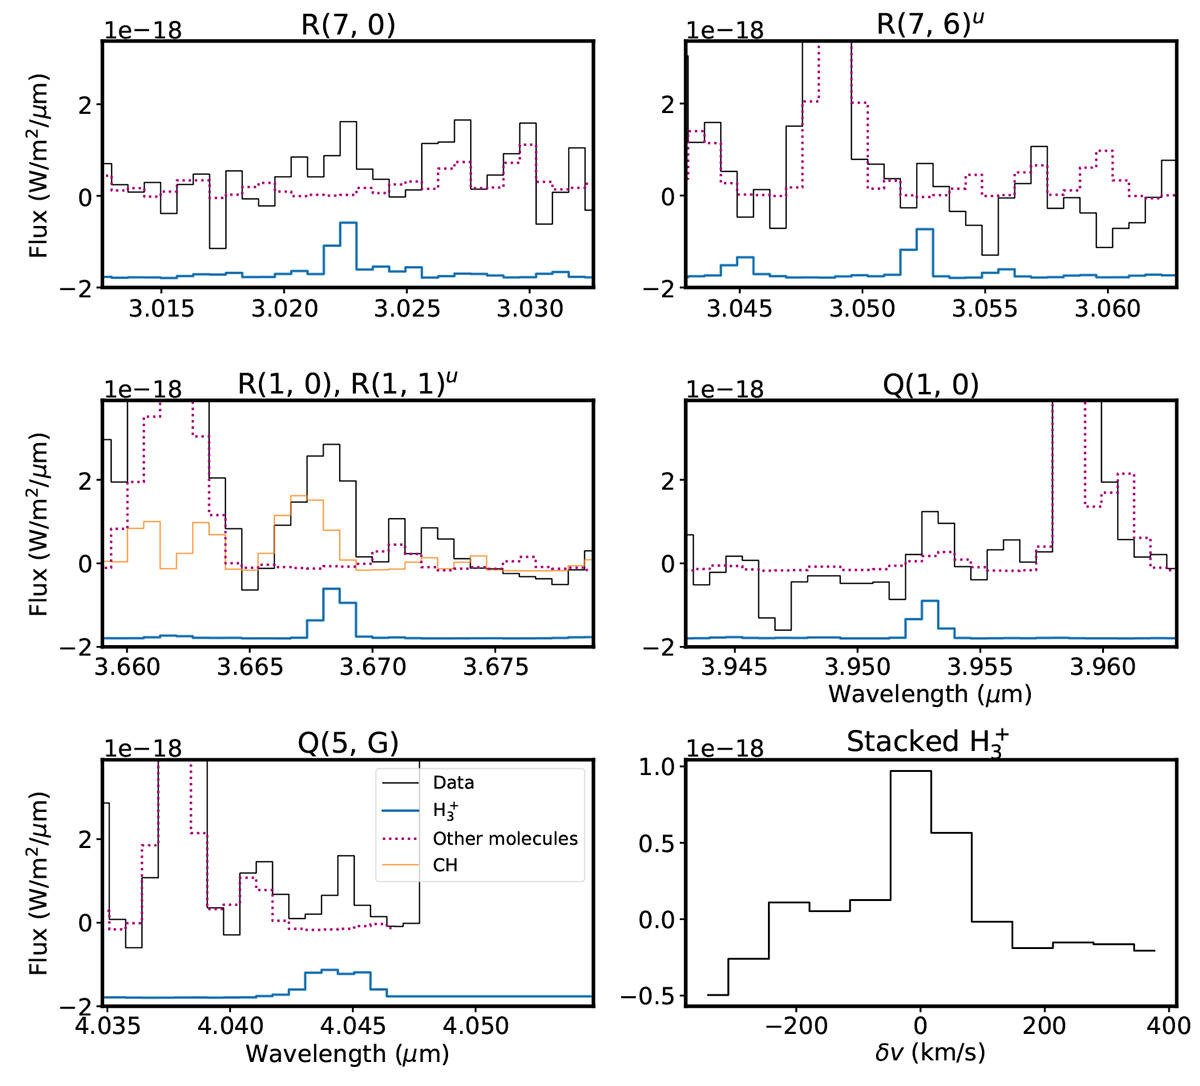
H![]() lines in d203-506. The label of each (centered) transition is indicated in the title of each panel, in the format Branch(J, G). In the bottom left panel, transitions with G = 0, 1, 2, and 3 are superimposed. Continuum-subtracted observational data are shown in black, centered on each H
lines in d203-506. The label of each (centered) transition is indicated in the title of each panel, in the format Branch(J, G). In the bottom left panel, transitions with G = 0, 1, 2, and 3 are superimposed. Continuum-subtracted observational data are shown in black, centered on each H![]() line. LTE models for H
line. LTE models for H![]() (blue), CH (orange), and other species (dotted magenta) are overplotted. H
(blue), CH (orange), and other species (dotted magenta) are overplotted. H![]() model has been vertically offset for clarity (see also Fig. B.1). The lower right panel shows the stacked H
model has been vertically offset for clarity (see also Fig. B.1). The lower right panel shows the stacked H![]() spectrum in velocity space (see Appendix B).
spectrum in velocity space (see Appendix B).
Current usage metrics show cumulative count of Article Views (full-text article views including HTML views, PDF and ePub downloads, according to the available data) and Abstracts Views on Vision4Press platform.
Data correspond to usage on the plateform after 2015. The current usage metrics is available 48-96 hours after online publication and is updated daily on week days.
Initial download of the metrics may take a while.