Open Access
Fig. 3.
Download original image
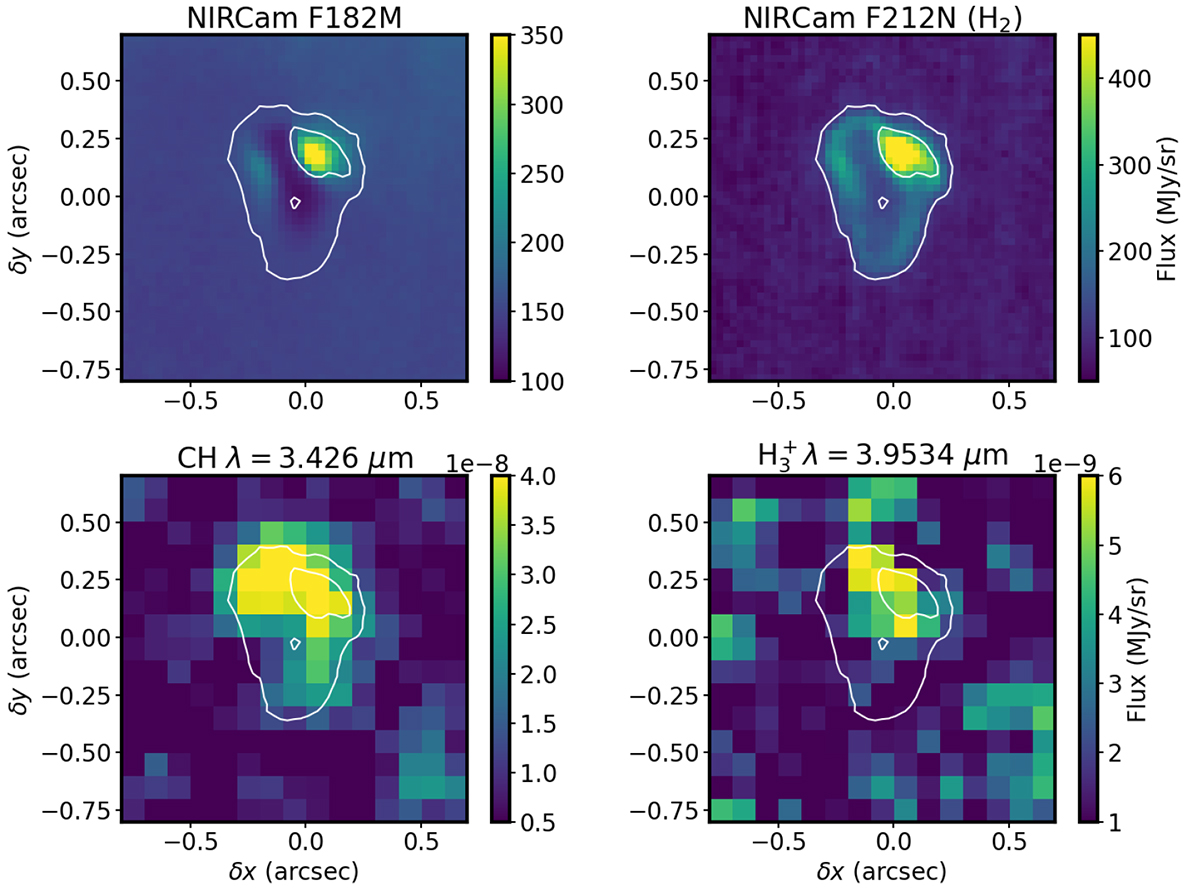
IR JWST images of d203-506. Top left: NIRCam F182M (broad filter centered at 1.82 μm). Top right: NIRCam F212N (H2 1-0 S(1) emission). Bottom left: NIRSpec CH emission map, continuum subtracted. Bottom right: NIRSpec Q(1,0) H![]() emission map, continuum subtracted. All panels show F212N contours in white.
emission map, continuum subtracted. All panels show F212N contours in white.
Current usage metrics show cumulative count of Article Views (full-text article views including HTML views, PDF and ePub downloads, according to the available data) and Abstracts Views on Vision4Press platform.
Data correspond to usage on the plateform after 2015. The current usage metrics is available 48-96 hours after online publication and is updated daily on week days.
Initial download of the metrics may take a while.