| Issue |
A&A
Volume 699, July 2025
|
|
|---|---|---|
| Article Number | C2 | |
| Number of page(s) | 2 | |
| Section | The Sun and the Heliosphere | |
| DOI | https://doi.org/10.1051/0004-6361/202555825e | |
| Published online | 14 July 2025 | |
Electron and proton peak intensities as observed by a five-spacecraft fleet in solar cycle 25 (Corrigendum)
1
Department of Physics and Astronomy, 20014 University of Turku, Finland
2
Heliophysics Science Division, NASA Goddard Space Flight Center, Greenbelt, MD 20771, USA
3
Department of Astronomy, University of Maryland, College Park, MD 20742, USA
4
Institute of Experimental and Applied Physics, Kiel University, Kiel, Germany
5
European Space Agency (ESA), European Space Astronomy Centre (ESAC), Camino Bajo del Castillo s/n, 28692 Villanueva de la Cañada, Madrid, Spain
6
Universidad de Alcalá, Space Research Group (SRG-UAH), Plaza de San Diego s/n, 28801 Alcalá de Henares, Madrid, Spain
⋆ Corresponding author: This email address is being protected from spambots. You need JavaScript enabled to view it.
Key words: errata, addenda / Sun: coronal mass ejections (CMEs) / Sun: flares / Sun: heliosphere / Sun: particle emission
A correction in 1 MeV electron peak intensities measured at Parker Solar Probe (PSP) is reported in the SERPENTINE SEP event catalog at https://doi.org/10.5281/zenodo.10732268, which was the main database used in Farwa et al. (2025). We updated the 1 MeV electron peak intensities measured by PSP in our study and noticed that these measurements are now systematically lower than STEREO A measurements. Because a re-normalization of PSP 1 MeV electron peak intensities was already applied in our original work (Farwa et al. 2025), the results of the study change only slightly, with no effect on the conclusions. However, we redetermined the inter-calibration factor for 1 MeV electrons measured by PSP based on a comparison with STEREO/HET measurements as presented in Appendix B of Farwa et al. (2025). The new analysis is shown in Fig. 1. The correct re-normalization factor obtained for the 1 MeV electrons is  . Applying this re-normalization factor to 1 MeV electron peak intensities, we found that only Fig. 3 (lower panel) in Farwa et al. (2025), which shows electron-to-proton peak intensity ratios, has a noticeable change in the position of PSP points. The updated figure is shown in Fig. 2.
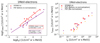 |
Fig. 1. Re-normalization applied to corrected PSP measurements for 1 MeV electrons. Left: Fits applied to STEREO A/HET and PSP data points for 1 MeV electrons. Right: Results of PSP re-normalization applied to 1 MeV electrons. The orange and purple plus signs represent the PSP data points before and after the re-normalization, respectively. This figure addresses the correction applied to Fig. B.3 (upper panel) of Farwa et al. (2025). |
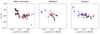 |
Fig. 2. Electron-to-proton peak intensity ratios for 1 MeV electrons using the updated PSP measurements as a function of ≥25 MeV proton peak intensities for well-connected (left), western (middle), and eastern (right) events. This figure addresses the correction applied to Fig. 3 (lower panel) of Farwa et al. (2025). |
Farwa et al. (2025) report various correlation coefficients (CCs), whose significance does not change after updating the 1 MeV electron PSP values. The changes in CCs are all minor. The original table of CCs from Farwa et al. (2025) is reproduced in Table 1; the values that changed are highlighted in red. Note that the last column refers to the figure numbers in Farwa et al. (2025).
Corrected Spearman CCs (p-values).
Data availability
The comprehensive table of all parameters employed in Farwa et al. (2025) for the analyzed solar energetic particle event sample has been updated accordingly at Zenodo at https://doi.org/10.5281/zenodo.15650284.
References
- Farwa, G. U., Dresing, N., Gieseler, J., et al. 2025, Astronomy& Astrophysics, 693, A198 [Google Scholar]
© The Authors 2025
 Open Access article, published by EDP Sciences, under the terms of the Creative Commons Attribution License (https://creativecommons.org/licenses/by/4.0), which permits unrestricted use, distribution, and reproduction in any medium, provided the original work is properly cited.
This article is published in open access under the Subscribe to Open model. This email address is being protected from spambots. You need JavaScript enabled to view it. to support open access publication.
All Tables
All Figures
|
Fig. 1. Re-normalization applied to corrected PSP measurements for 1 MeV electrons. Left: Fits applied to STEREO A/HET and PSP data points for 1 MeV electrons. Right: Results of PSP re-normalization applied to 1 MeV electrons. The orange and purple plus signs represent the PSP data points before and after the re-normalization, respectively. This figure addresses the correction applied to Fig. B.3 (upper panel) of Farwa et al. (2025). |
| In the text | |
|
Fig. 2. Electron-to-proton peak intensity ratios for 1 MeV electrons using the updated PSP measurements as a function of ≥25 MeV proton peak intensities for well-connected (left), western (middle), and eastern (right) events. This figure addresses the correction applied to Fig. 3 (lower panel) of Farwa et al. (2025). |
| In the text | |
Current usage metrics show cumulative count of Article Views (full-text article views including HTML views, PDF and ePub downloads, according to the available data) and Abstracts Views on Vision4Press platform.
Data correspond to usage on the plateform after 2015. The current usage metrics is available 48-96 hours after online publication and is updated daily on week days.
Initial download of the metrics may take a while.