Fig. 8.
Download original image
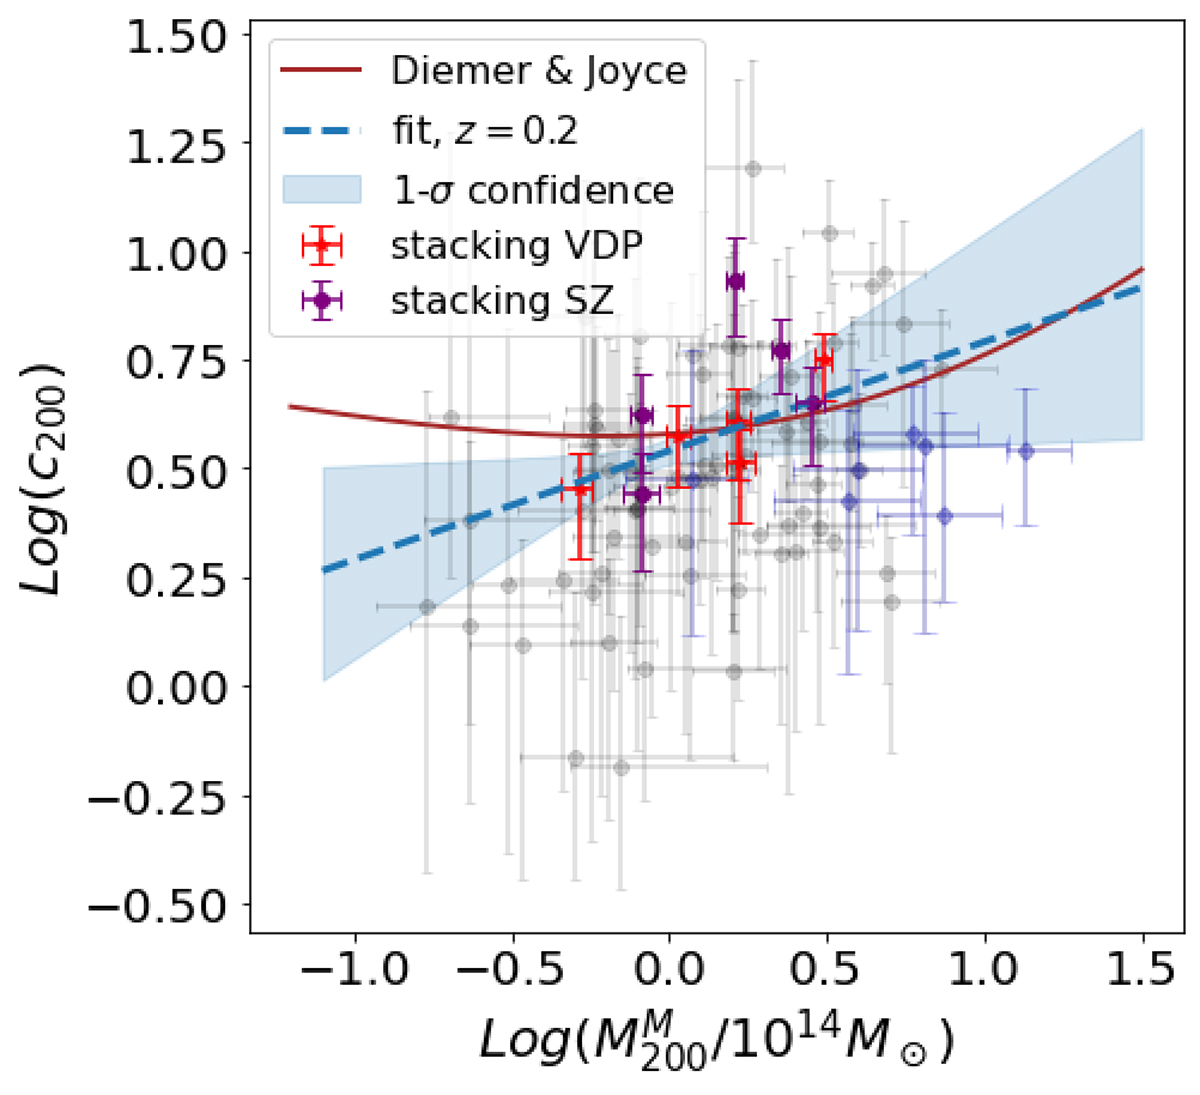
Concentration–mass relation for the CHEX-MATE sample. The error bars indicate 68% uncertainties in the parameters; we highlight in light blue the clusters with ![]() . The dashed blue line is the best-fit Bayesian linear regression derived using the Sereno & Ettori (2015b) method; the shaded region represents the corresponding 1σ contour. Purple and red crosses indicate the values obtained by stacking clusters in bin of SZ mass and σap, 200, as explained in Sect. 5. The solid brown line shows the theoretical prediction of Diemer & Joyce (2019).
. The dashed blue line is the best-fit Bayesian linear regression derived using the Sereno & Ettori (2015b) method; the shaded region represents the corresponding 1σ contour. Purple and red crosses indicate the values obtained by stacking clusters in bin of SZ mass and σap, 200, as explained in Sect. 5. The solid brown line shows the theoretical prediction of Diemer & Joyce (2019).
Current usage metrics show cumulative count of Article Views (full-text article views including HTML views, PDF and ePub downloads, according to the available data) and Abstracts Views on Vision4Press platform.
Data correspond to usage on the plateform after 2015. The current usage metrics is available 48-96 hours after online publication and is updated daily on week days.
Initial download of the metrics may take a while.