Fig. 7.
Download original image
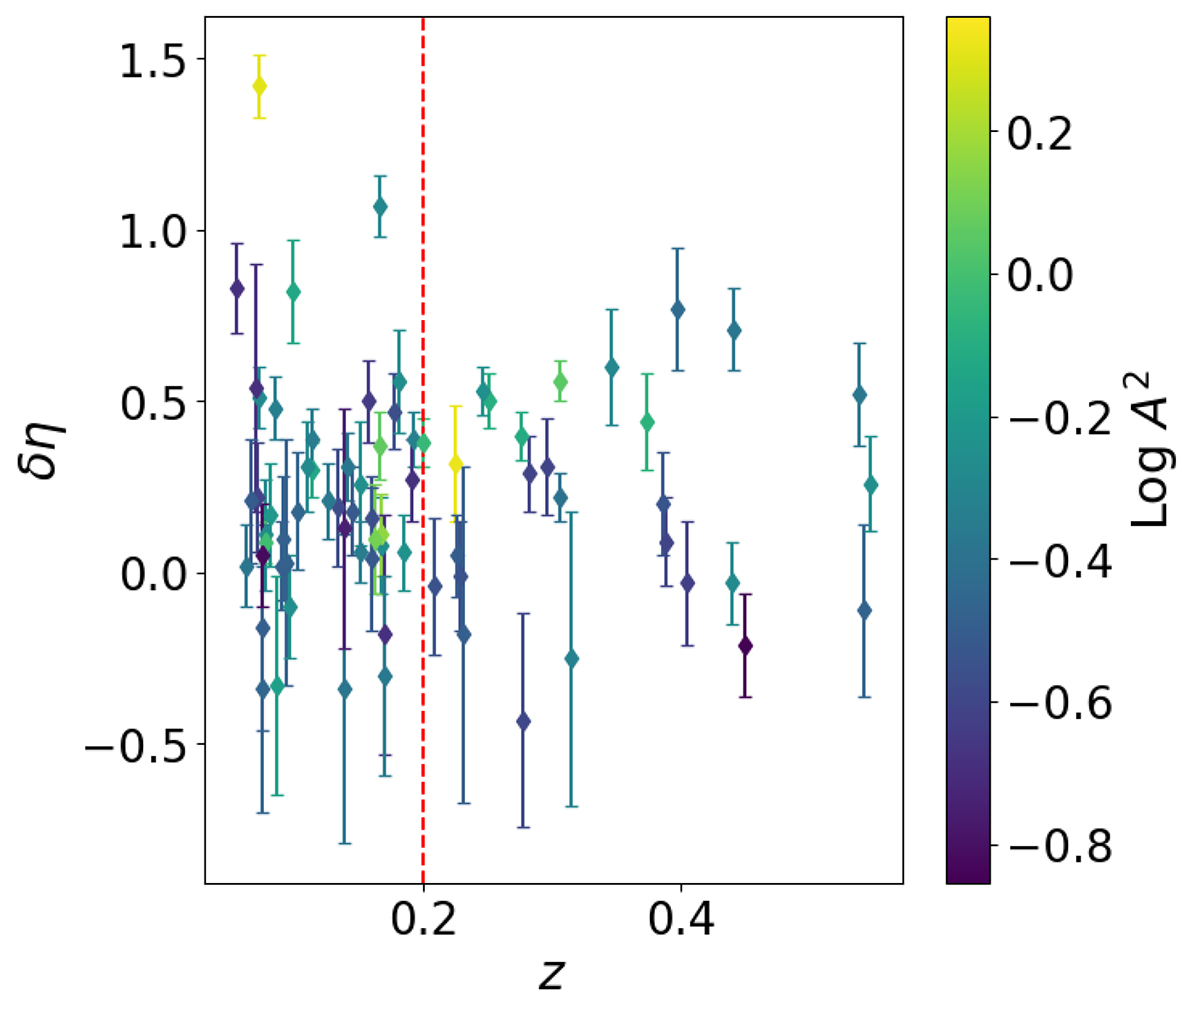
![]() as a function of the redshift. The error bars indicate the 68% statistical uncertainties. Points are colour-coded according to the values of the A2 coefficient. The red vertical line indicates the pivot redshift z = 0.2. Note that we have included the four outliers (δη > 0.8) as well as the full double systems PSZ2G040.03+74.95 and PSZ2G218.81+35.51 to highlight the values of A2.
as a function of the redshift. The error bars indicate the 68% statistical uncertainties. Points are colour-coded according to the values of the A2 coefficient. The red vertical line indicates the pivot redshift z = 0.2. Note that we have included the four outliers (δη > 0.8) as well as the full double systems PSZ2G040.03+74.95 and PSZ2G218.81+35.51 to highlight the values of A2.
Current usage metrics show cumulative count of Article Views (full-text article views including HTML views, PDF and ePub downloads, according to the available data) and Abstracts Views on Vision4Press platform.
Data correspond to usage on the plateform after 2015. The current usage metrics is available 48-96 hours after online publication and is updated daily on week days.
Initial download of the metrics may take a while.