Fig. 5.
Download original image
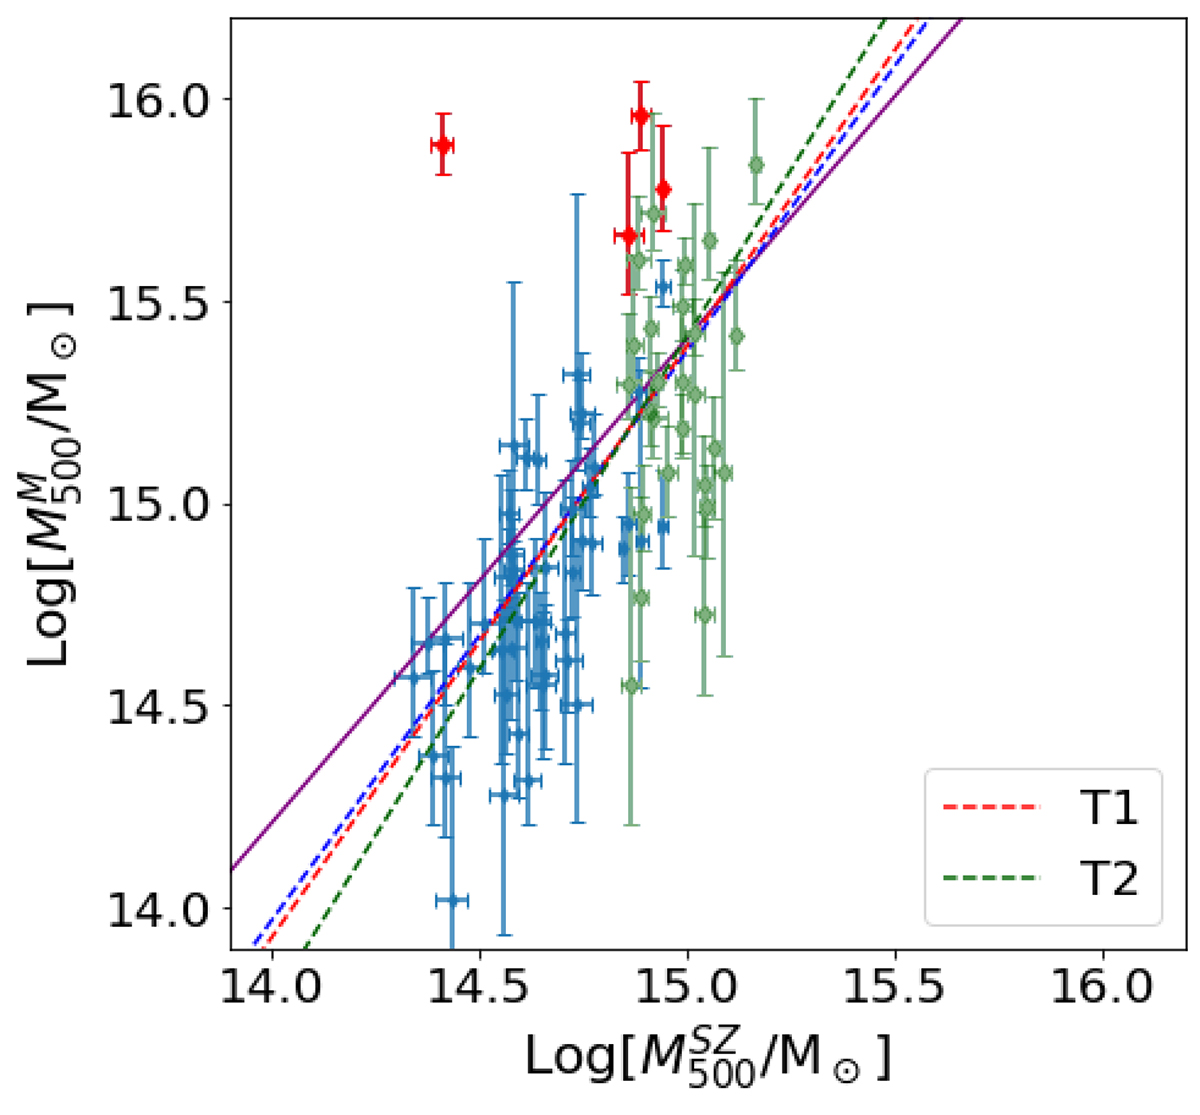
Scatter plot of M500 inferred from the SZ effect by Planck (on the vertical axis) and from the kinematic analysis with MG-MAMPOSST (horizontal axis). The error bars represent the 68% CL, and the red points show those clusters for which the logarithmic difference (δη) is larger than 0.8 dex. Dark green points highlight clusters belonging to T2. The purple line is the ODR fit that considers all the clusters, while the blue one is the linear fit done by discarding the four outliers. The best-fit (with the outliers removed) linear models for T1 and T2 are shown separately with the dashed red and dark green lines, respectively.
Current usage metrics show cumulative count of Article Views (full-text article views including HTML views, PDF and ePub downloads, according to the available data) and Abstracts Views on Vision4Press platform.
Data correspond to usage on the plateform after 2015. The current usage metrics is available 48-96 hours after online publication and is updated daily on week days.
Initial download of the metrics may take a while.