Open Access
Fig. 4.
Download original image
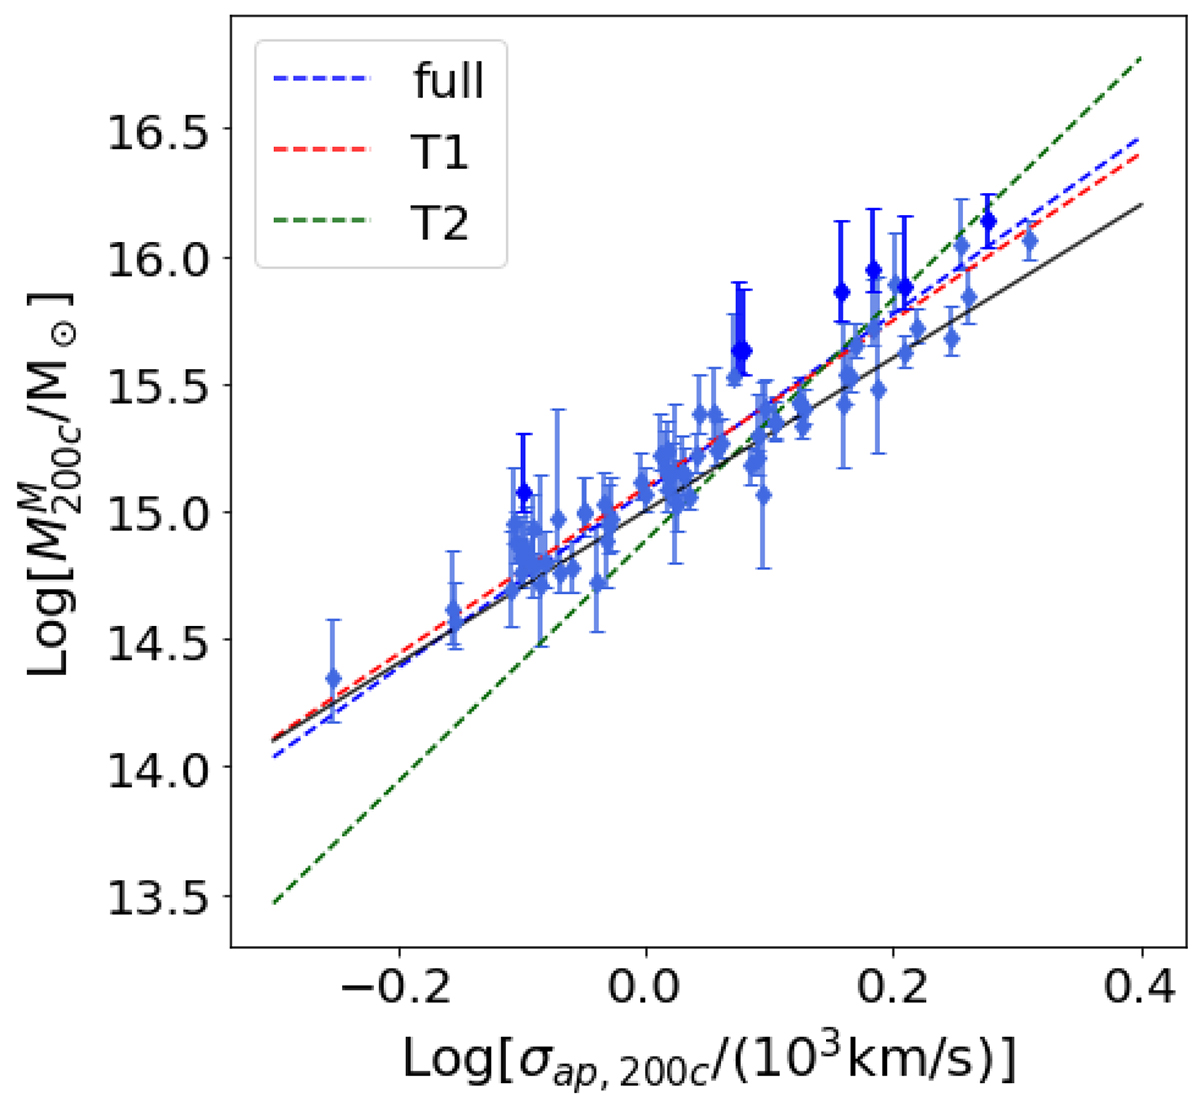
Logarithm of the aperture velocity dispersion within R = r200, σap, 200 compared to the logarithm of M200M estimated from MG-MAMPOSST. The bars refer to 68% uncertainties. The blue line indicates the best-fit linear model of Eq. (9) when z = 0.2. The solid black line identifies the σ ∝ M3 relation.
Current usage metrics show cumulative count of Article Views (full-text article views including HTML views, PDF and ePub downloads, according to the available data) and Abstracts Views on Vision4Press platform.
Data correspond to usage on the plateform after 2015. The current usage metrics is available 48-96 hours after online publication and is updated daily on week days.
Initial download of the metrics may take a while.