Open Access
Fig. 3.
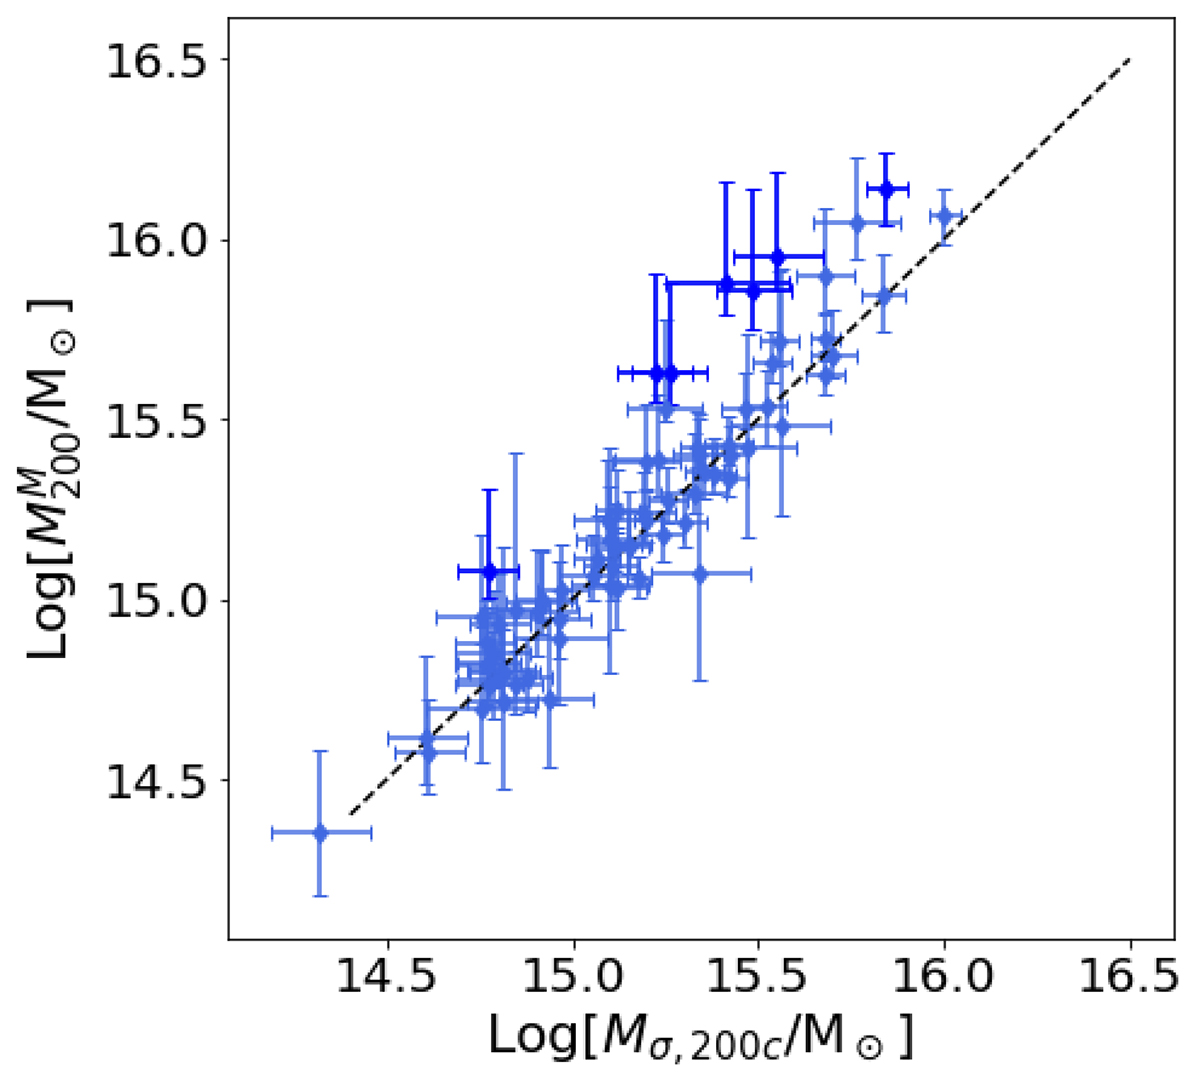
Download original image
Scatter plot of Log M200, inferred from the kinematic analysis with MG-MAMPOSST (vertical axis), and Log Mσ, 200c obtained by Sereno et al. (2025, horizontal axis). The error bars represent the 68% CL, and the dashed black line the bisector. Darker points highlight those clusters for which Log (M200M/Mσ, 200c) > 0.3.
Current usage metrics show cumulative count of Article Views (full-text article views including HTML views, PDF and ePub downloads, according to the available data) and Abstracts Views on Vision4Press platform.
Data correspond to usage on the plateform after 2015. The current usage metrics is available 48-96 hours after online publication and is updated daily on week days.
Initial download of the metrics may take a while.